Cell Annotation
Shows how to assign cell type labels to your cells: by hand, from enrichment results, or automatically with SingleR, CellTypist or Geneformer.
1Open the Cell Annotation tab
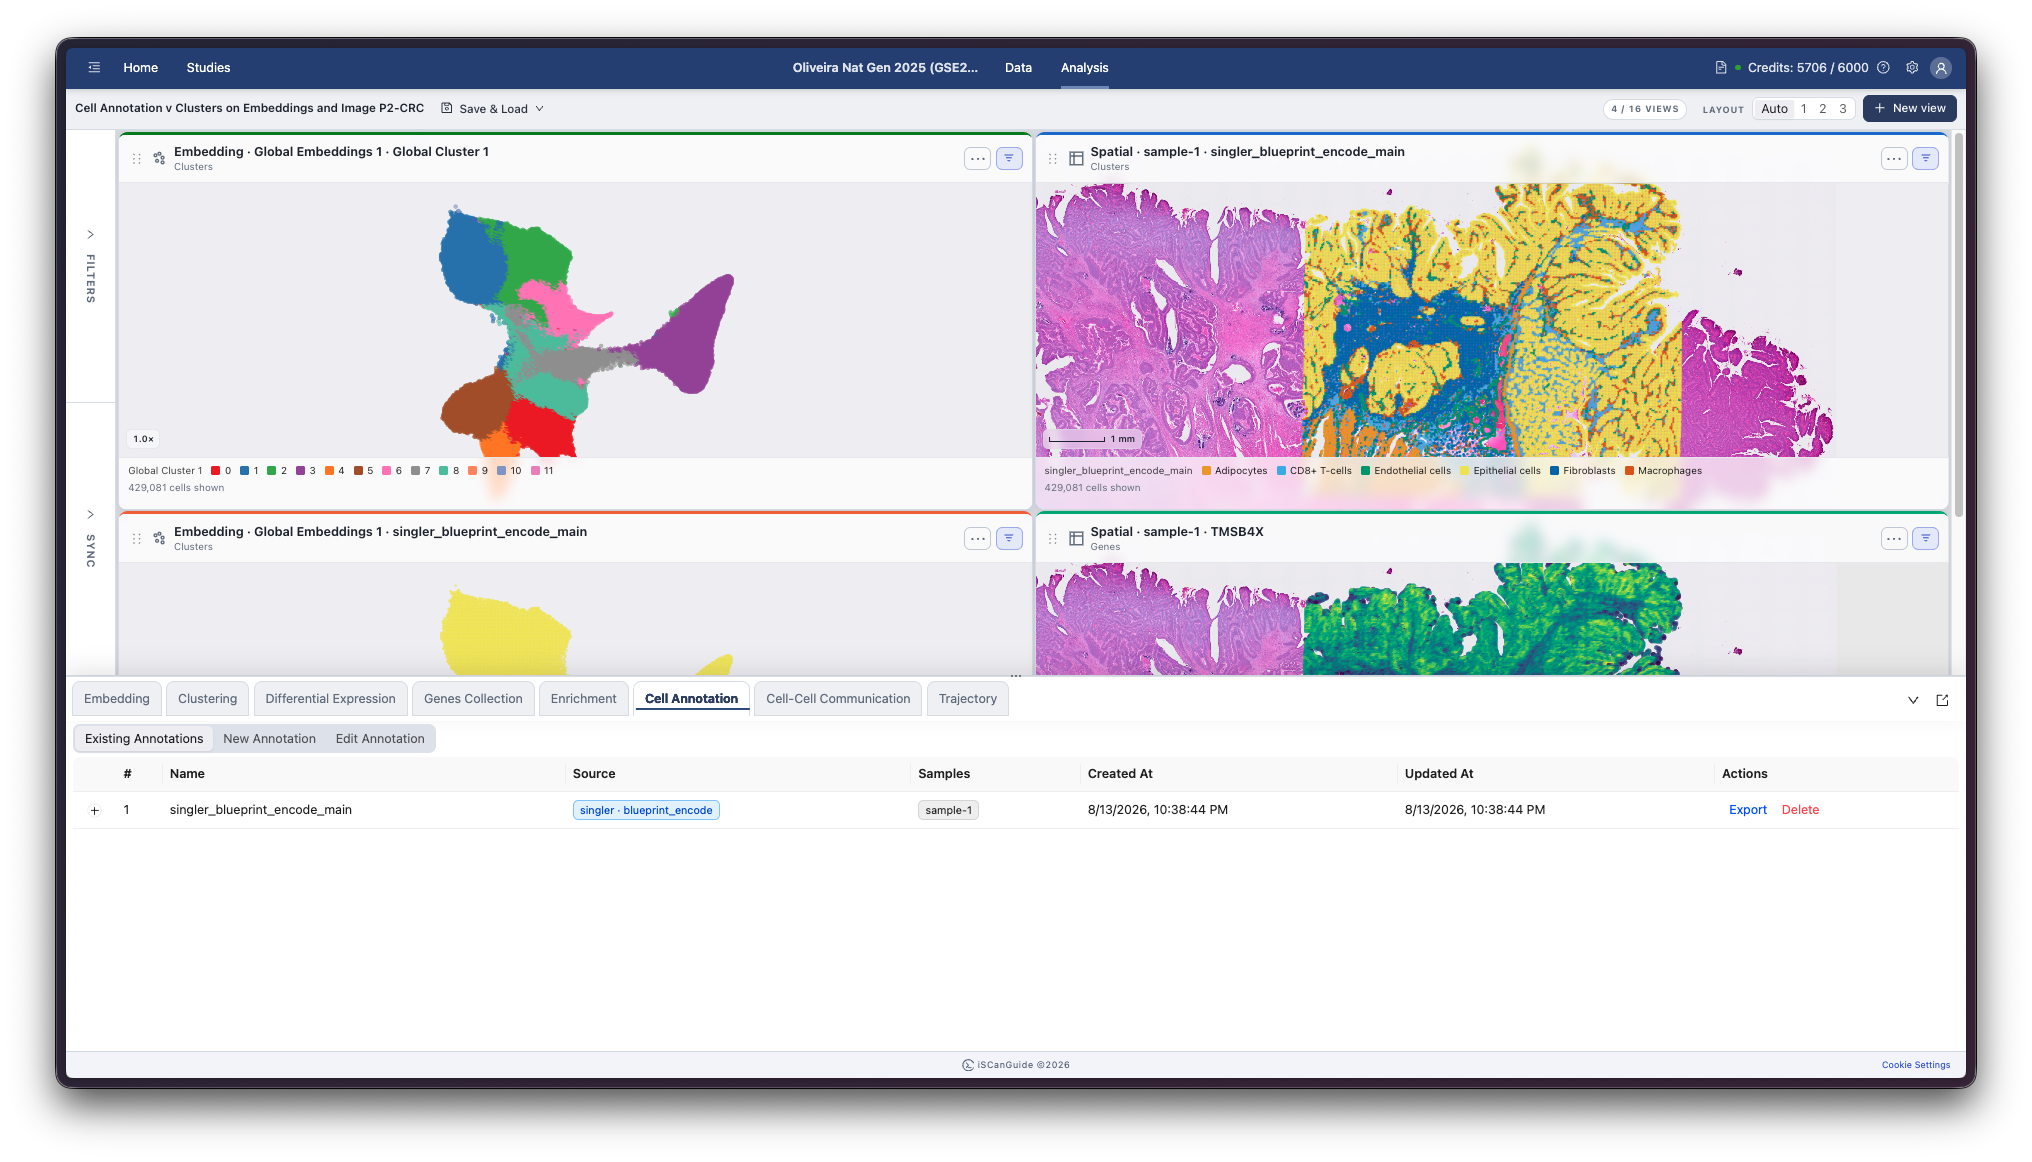
Open Cell Annotation in the bottom drawer. An annotation assigns a cell type label to each cell or to each group of cells.
2Choose how to annotate
Using existing data labels groups yourself. From enrichment labels them using cell type enrichment results. Automated annotation predicts labels with SingleR, CellTypist or Geneformer.
Note: your selections are kept when switching modes, so you can compare approaches without losing a partly filled form.
3Choose what to annotate
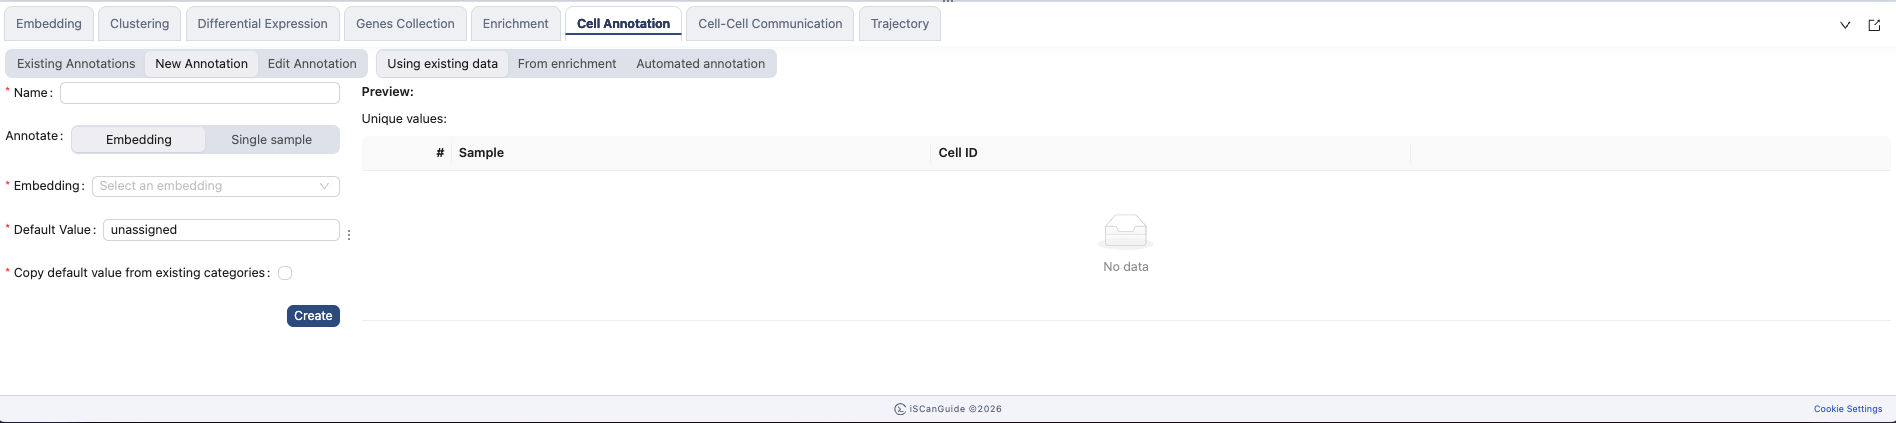
Every mode starts by asking what to annotate: a whole embedding across all its samples, or a single sample on its own.
Note: Single sample lists spatial samples only, because there is no per-sample viewer for non-spatial data. Use Embedding for non-spatial samples.
4Label groups yourself
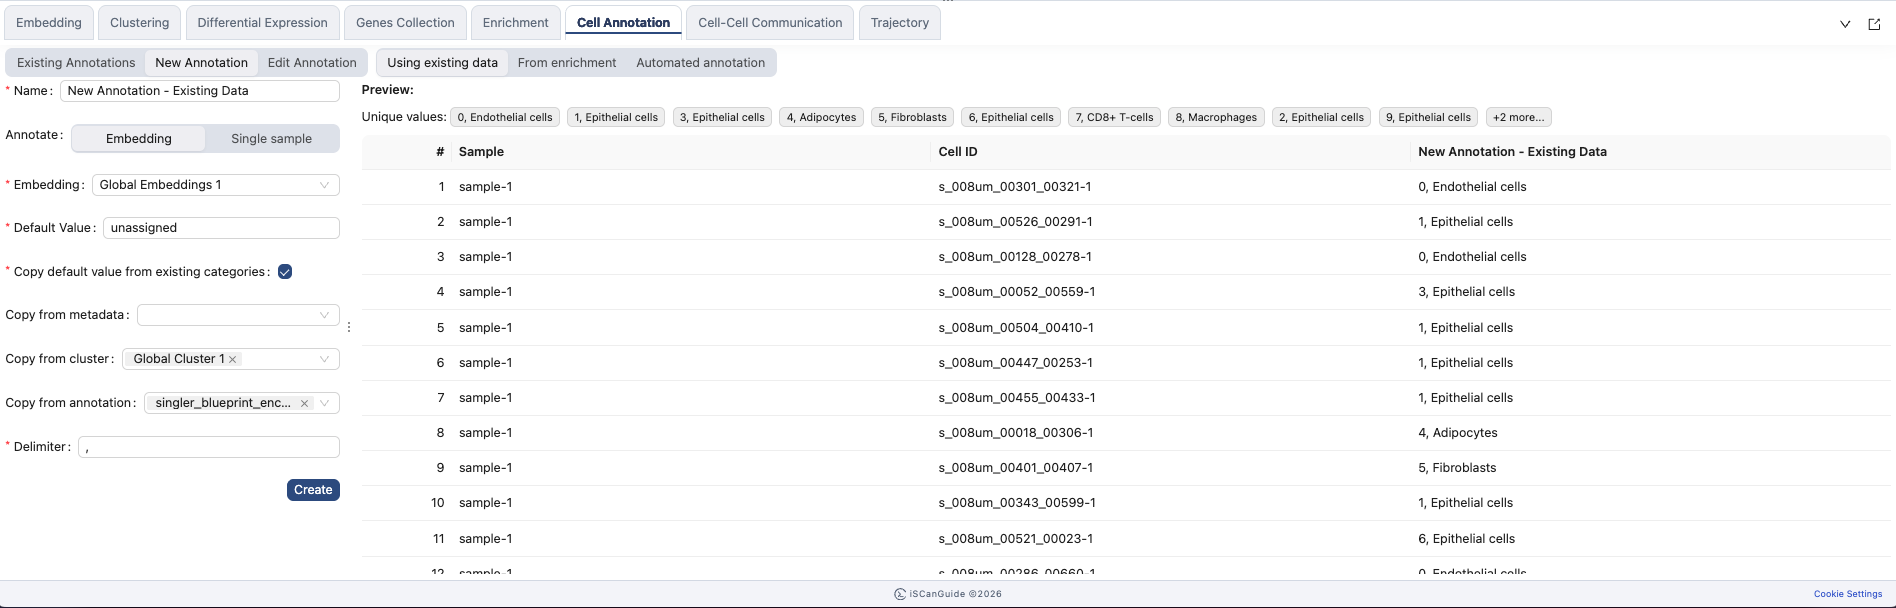
Start from clusters, metadata or an existing annotation, then give each group a label. The preview shows the annotation as you build it.
5Label groups from enrichment
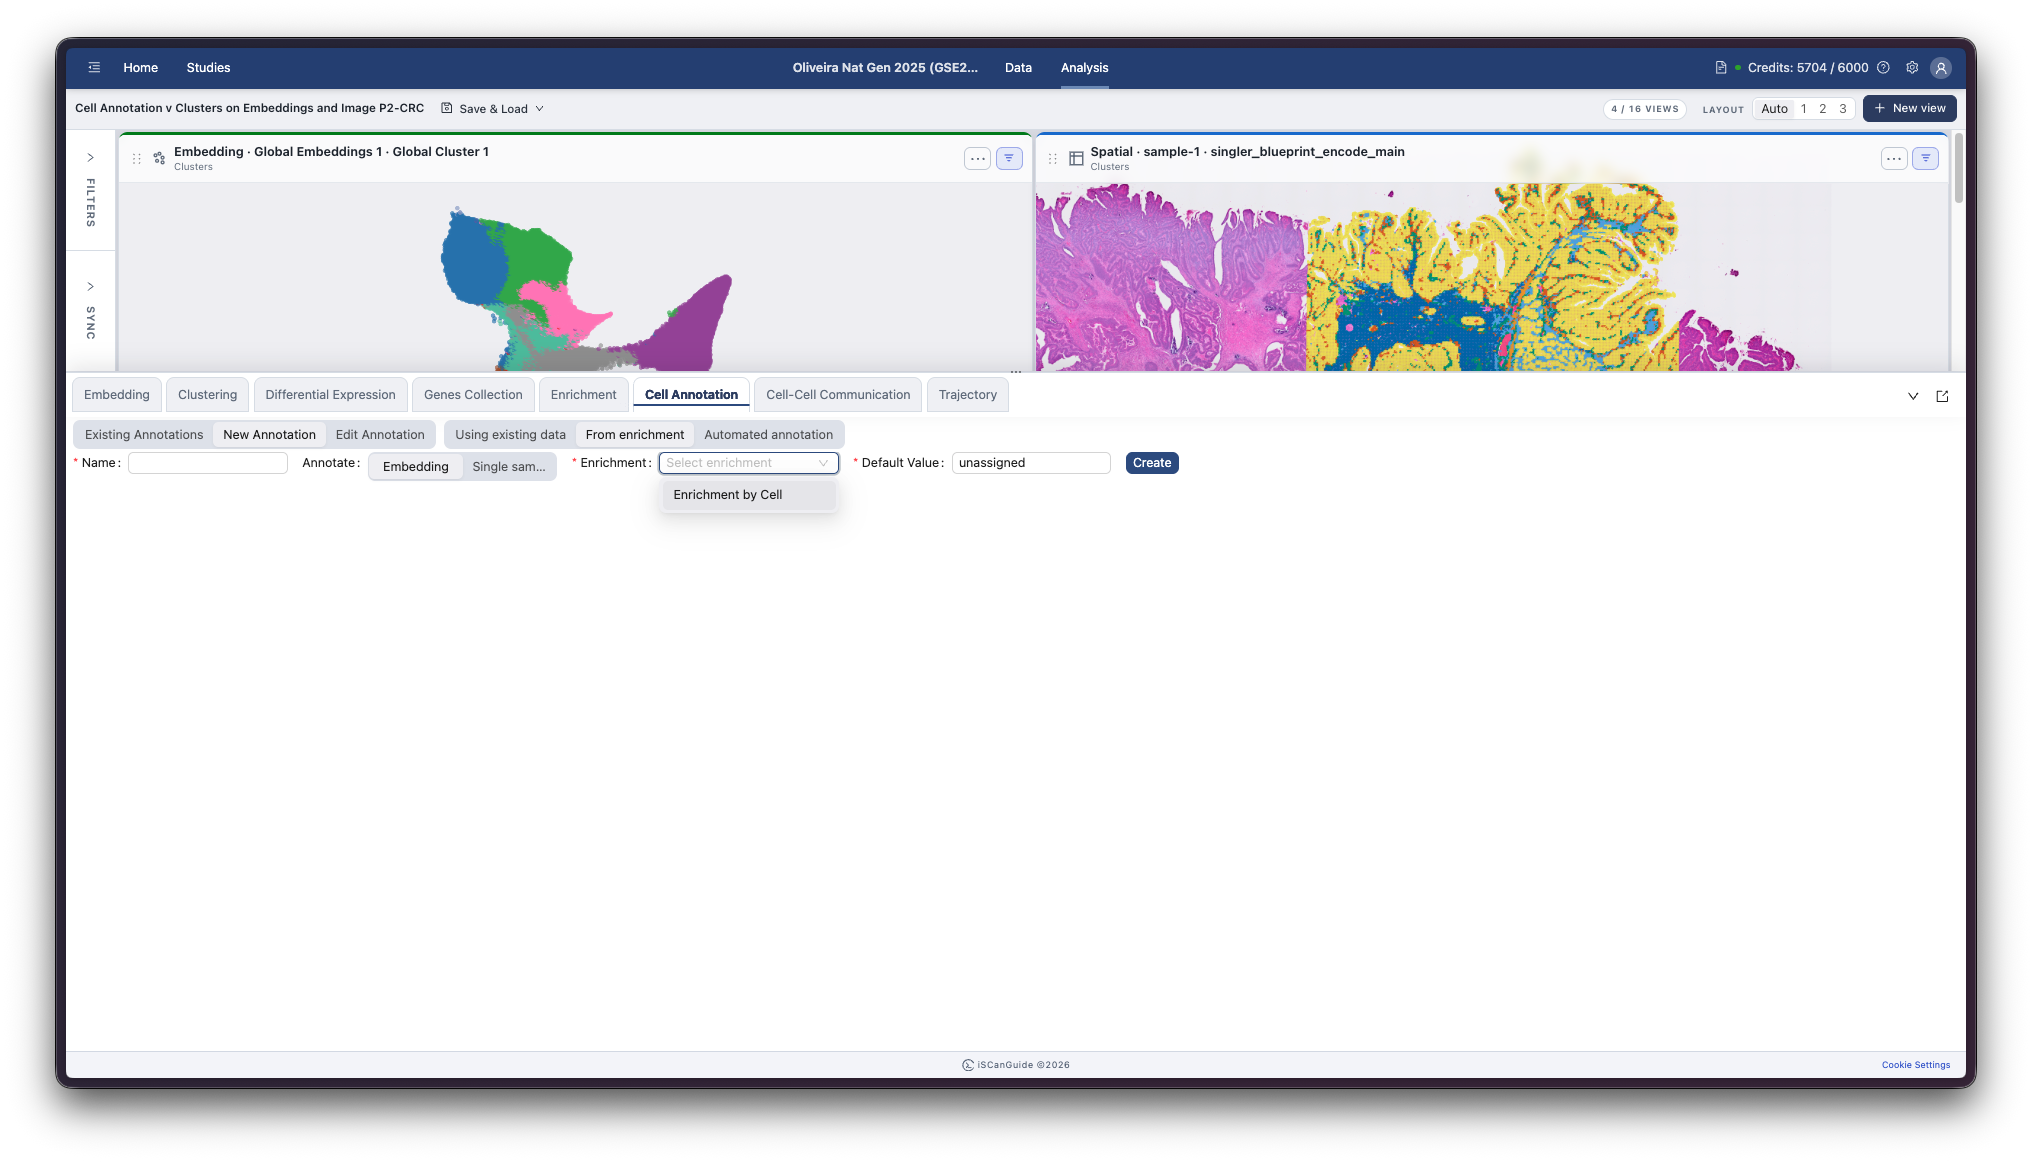
Choose what defines your groups, then label them using the enrichment evidence. The dot plot shows which cell types are supported in each group. Default Value labels anything you do not assign.
6Choose an automated method
Select Automated annotation, then pick a Method. A short description of the selected method appears beneath the picker.
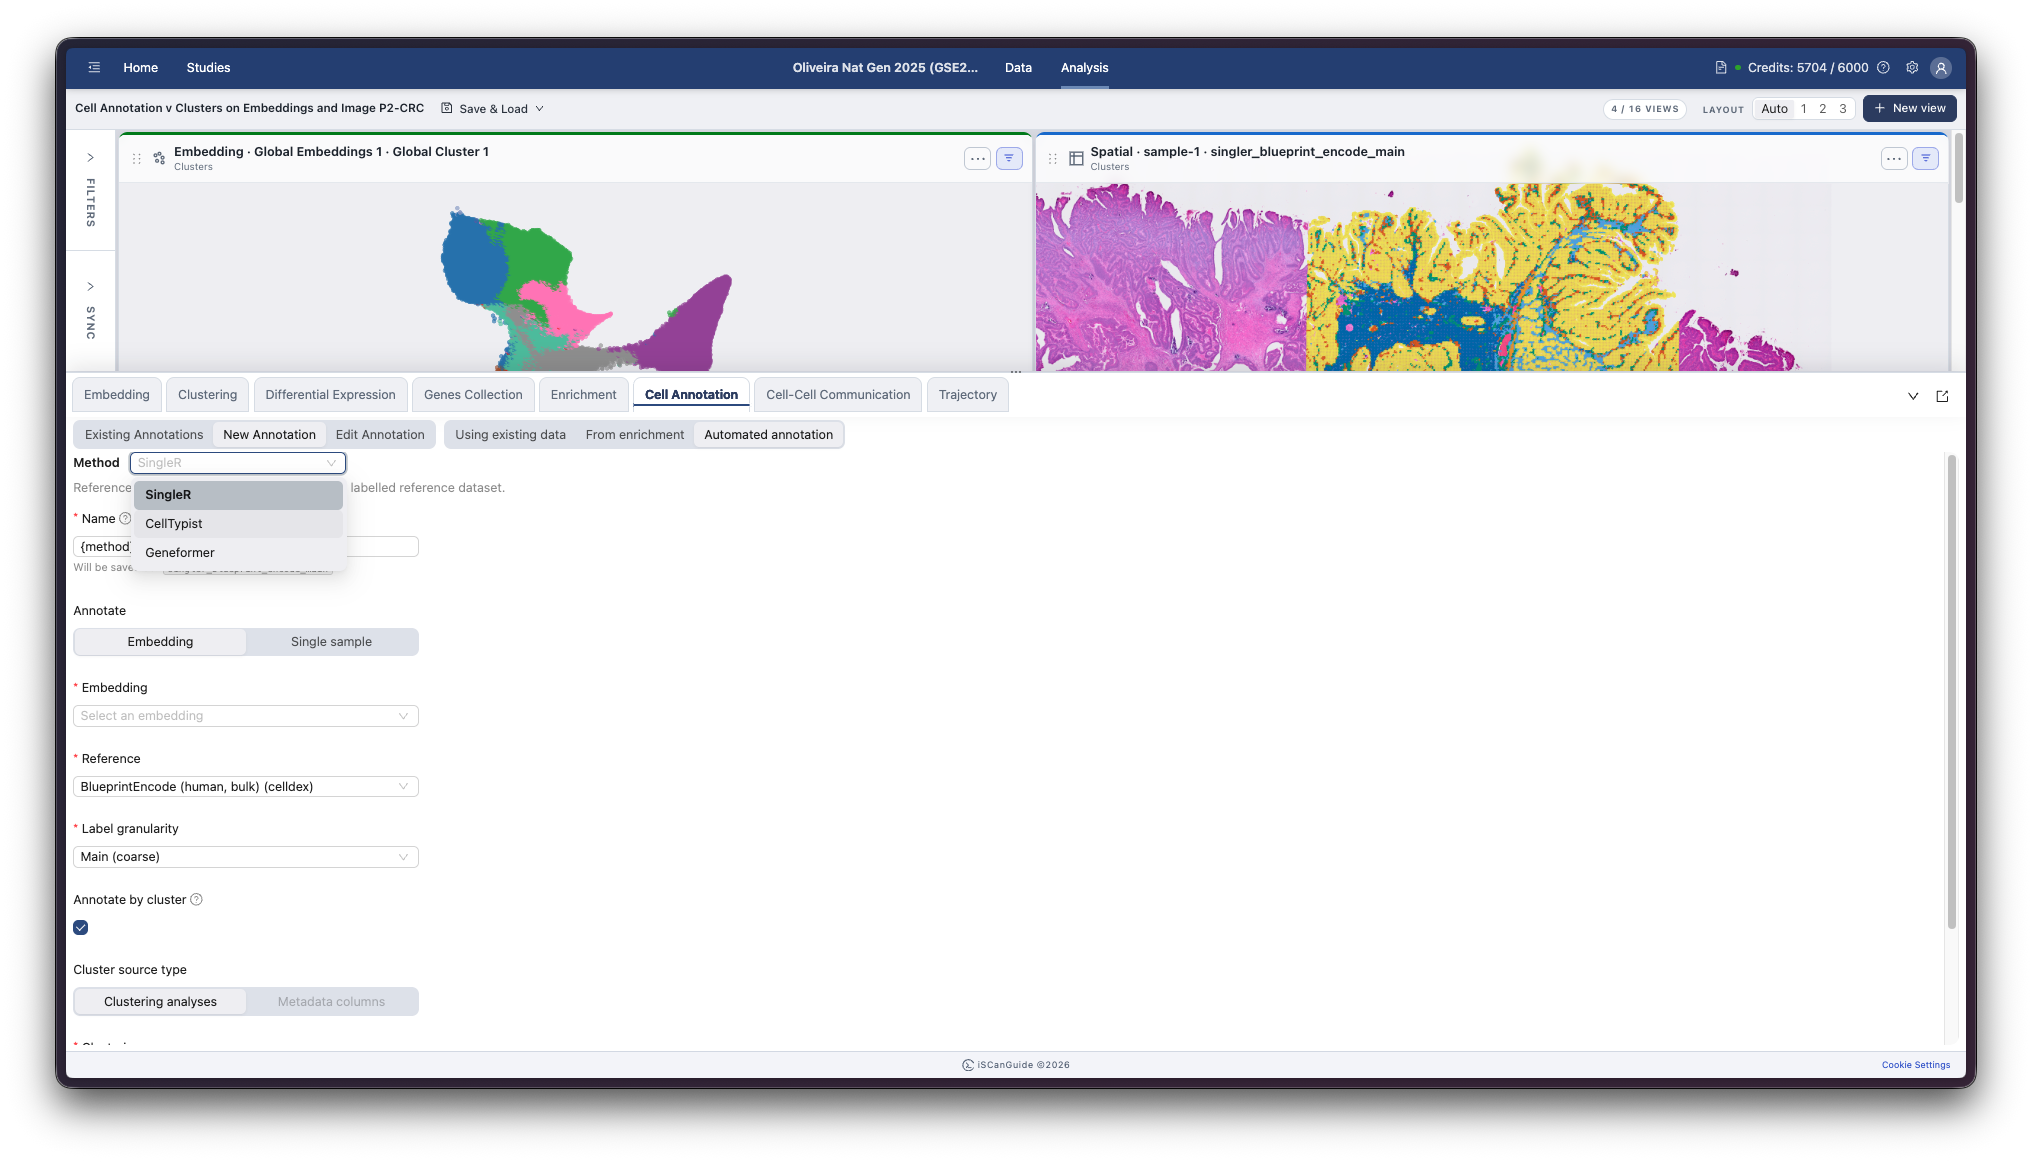
Methods
| Method | Description shown in the app |
|---|---|
SingleR | Reference-based cell type annotation against a labelled reference dataset. |
CellTypist | Probability-based cell type annotation using a pre-trained CellTypist model. |
Geneformer | Cell type annotation using a fine-tuned Geneformer transformer model. |
SingleR is selected by default.
7Name the annotation
The name starts from a template and fills in as you make selections. The resolved name is shown under the field.
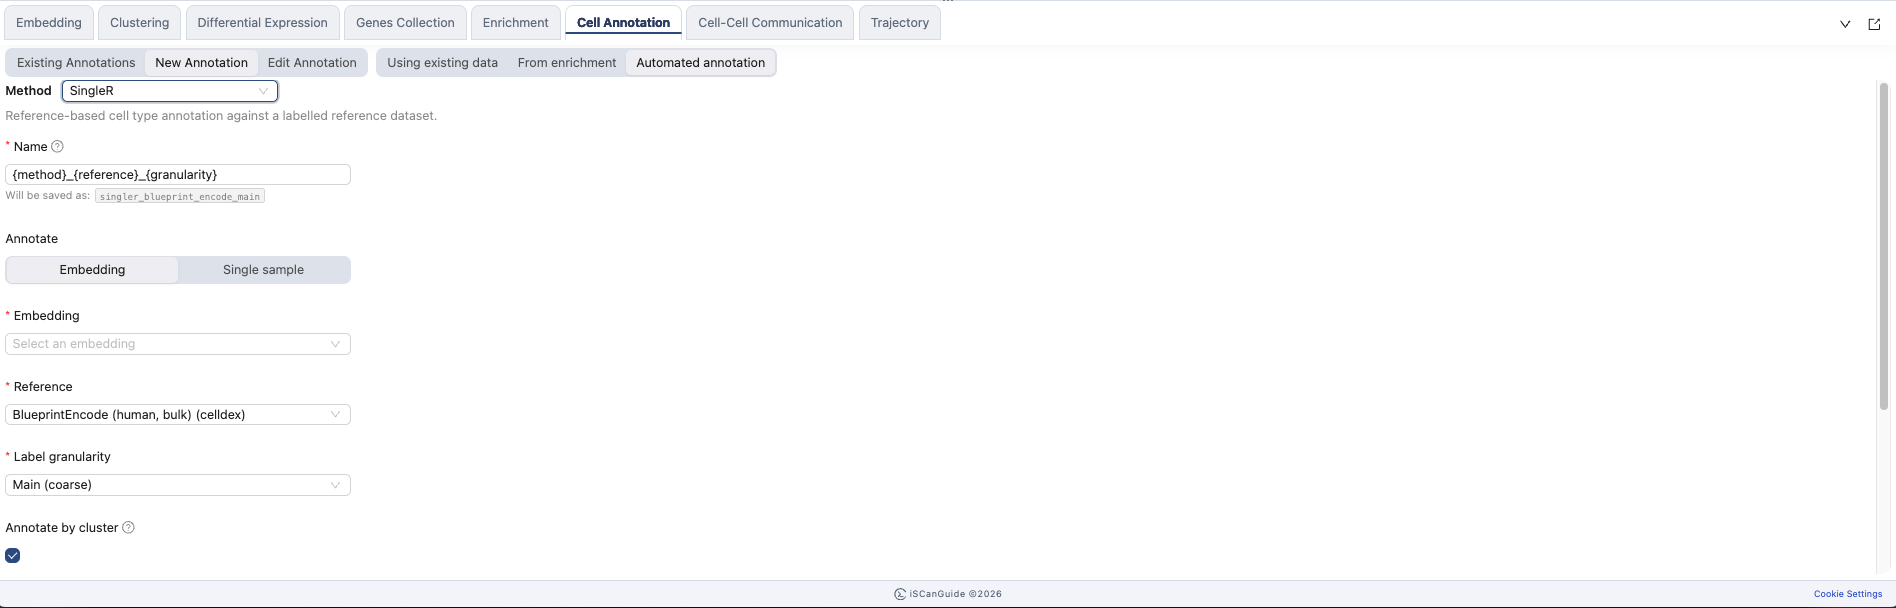
Templates
| Method | Template |
|---|---|
SingleR | {method}_{reference}_{granularity} |
CellTypist | {method}_{model} |
Geneformer | {method}_{model} |
8Annotate by cluster
Annotate by cluster to group cells first and give every cell in a group the same label. It is much faster than labelling each cell. Choose whether the groups come from a clustering result or a metadata column.
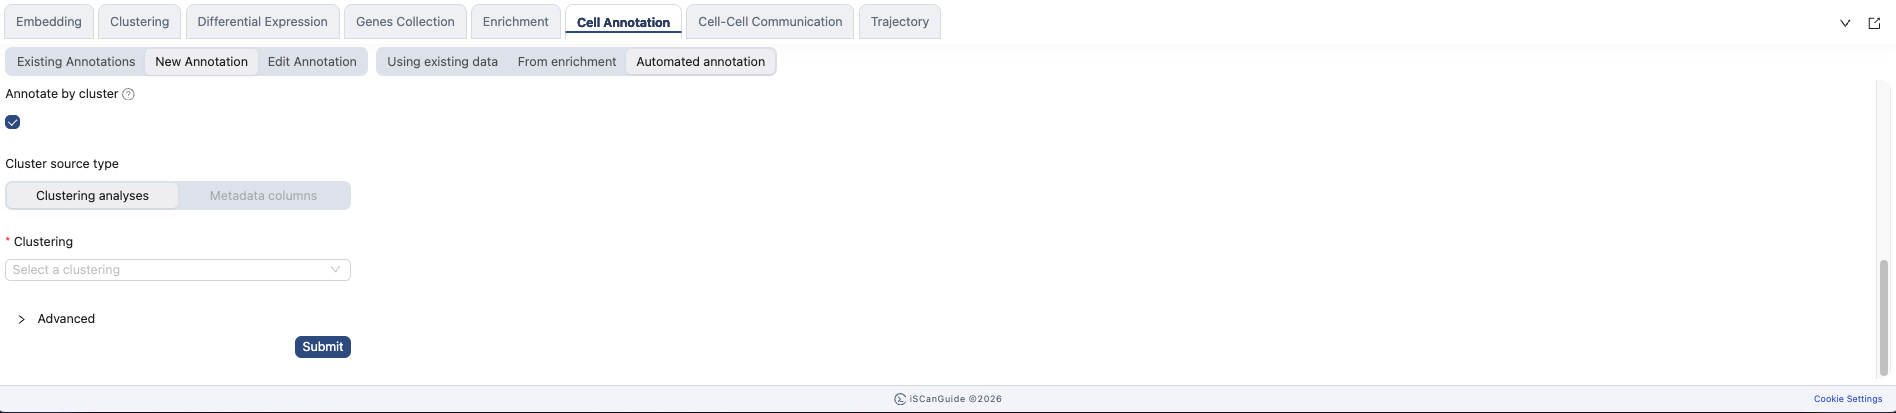
Note: Geneformer always annotates by cluster and its checkbox cannot be turned off.
Note: changing the embedding clears the cluster source, because the valid clusterings and metadata columns depend on it.
9SingleR
SingleR scores your cells against a labelled reference dataset. Pick the reference, then choose how detailed the labels should be. The granularity options come from the reference you selected.
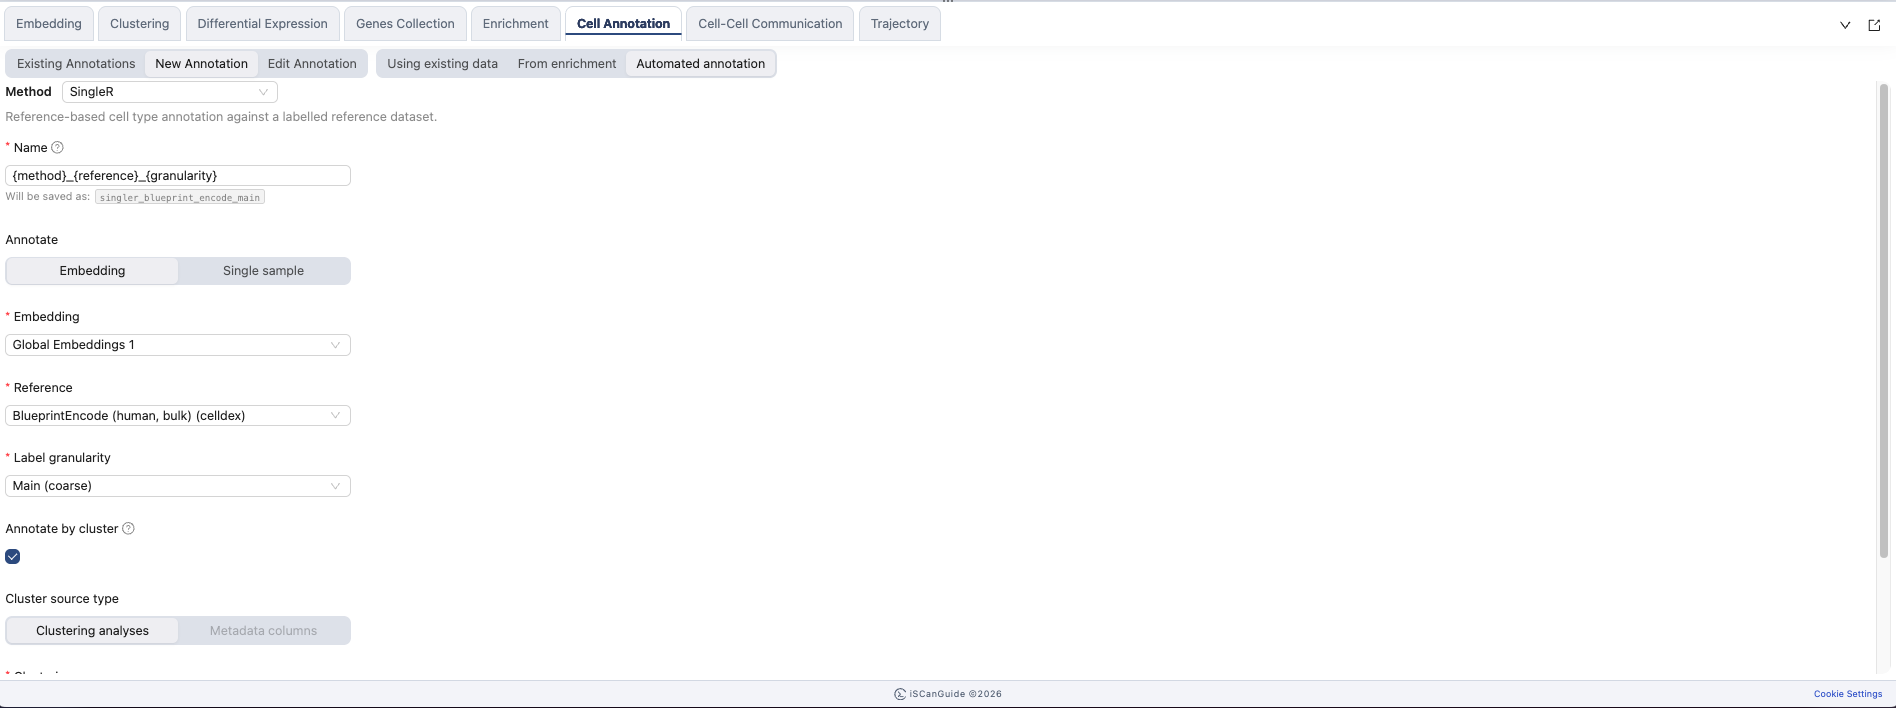
Advanced
| Field | Default | What it does |
|---|---|---|
Fine-tune | on | Second pass over close-competitor labels, using finer markers |
Fine-tune threshold | 0.05 | Score gap from the top label for a label to be refined. Typical 0–0.1 |
Outlier cutoff (MADs) | 3 | Cells this many MADs below their label's median confidence become Unassigned. Lower is stricter. Typical 2–5 |
10CellTypist
CellTypist predicts labels with a pre-trained model and a probability for each. Cells below the probability threshold are marked Unassigned. Raising the threshold marks more cells Unassigned.
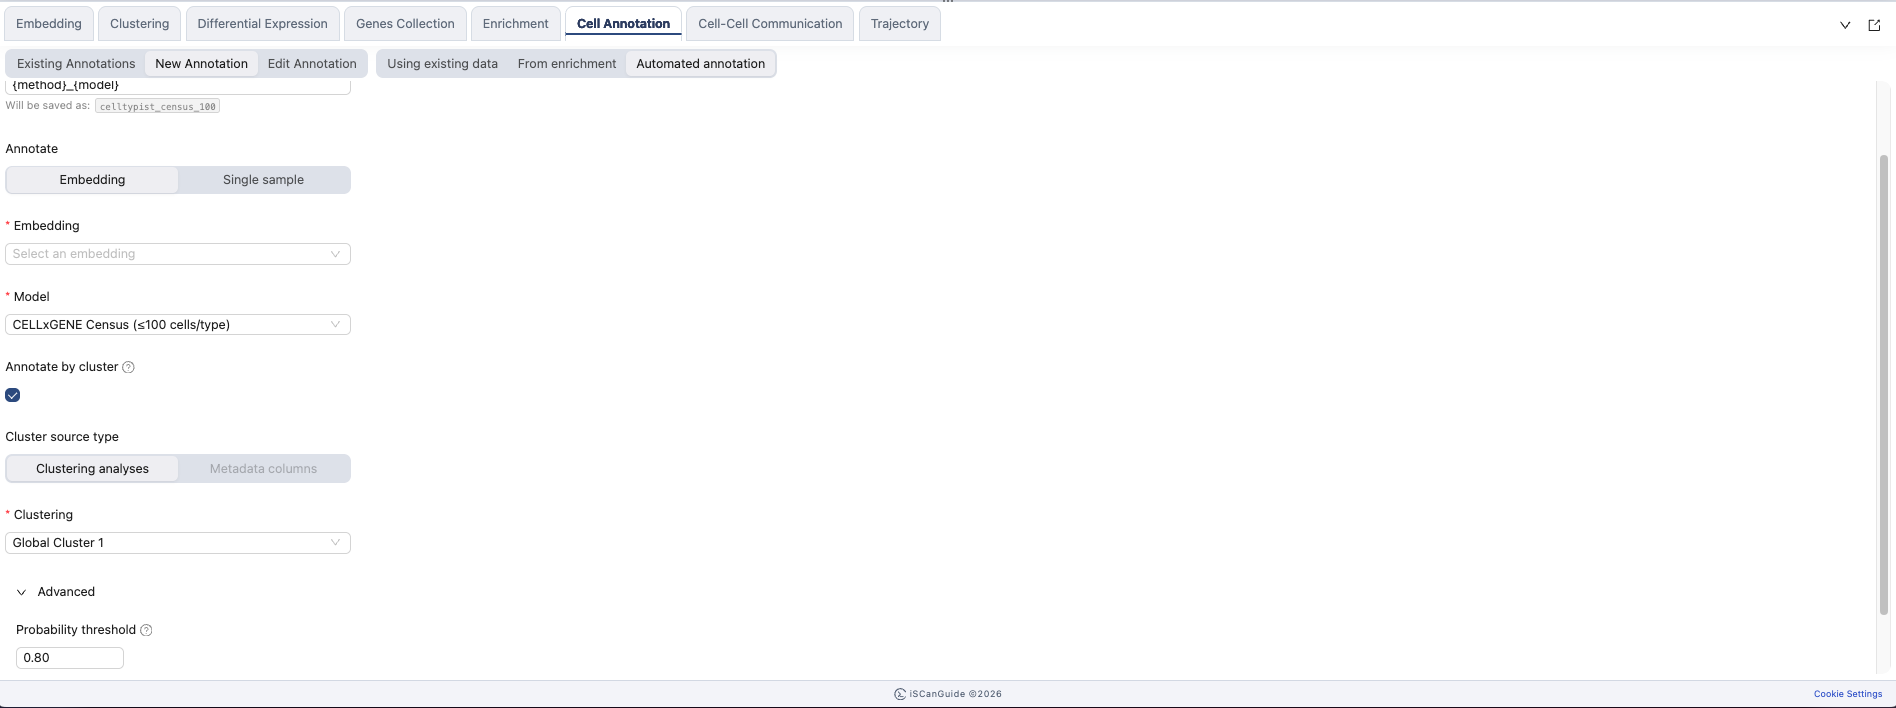
11Geneformer
Geneformer predicts labels with a fine-tuned transformer model. It annotates a whole embedding and always works by cluster: it predicts a subset of each group and gives the whole group the majority label.
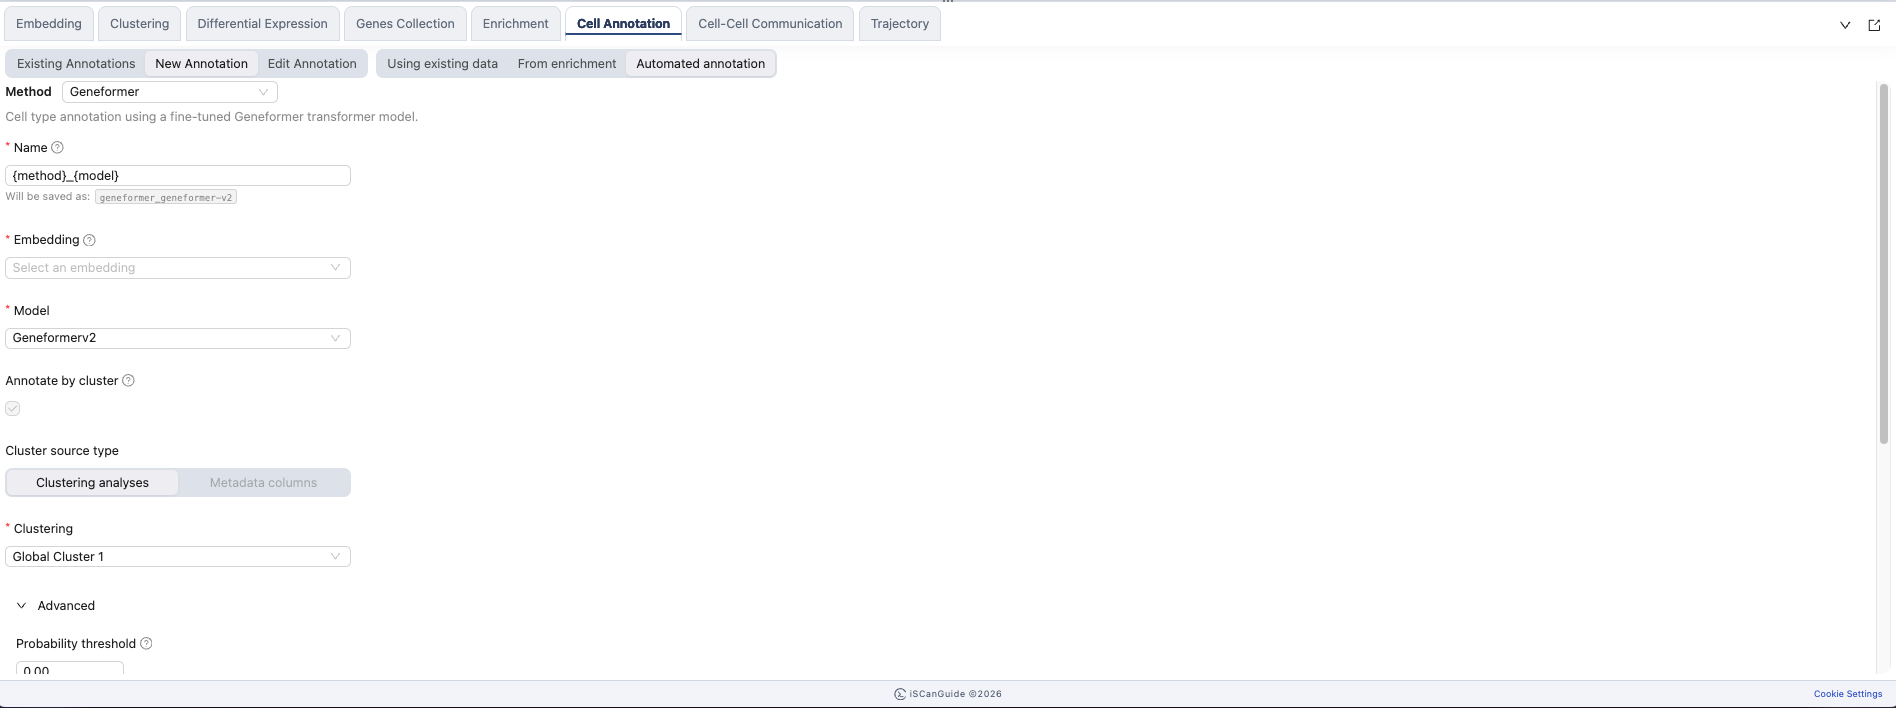
Advanced
| Field | Default | What it does |
|---|---|---|
Probability threshold | 0.0 | Minimum softmax confidence to keep a label. Below it, Unassigned |
Max cells per group | 10,000 | Cells sampled per group before prediction. 0 means no cap |
Global subsample | 0 | Overall cap on cells predicted, on top of the per-group cap. 0 is off |
Random seed | 42 | Makes the subsampling reproducible |
Forward batch size | 100 | Inference batch size |
12Results and management
Click Submit to queue the job. When it finishes, the annotation appears in the list and you can create a view coloured by it like any other observation. Cells that could not be labelled confidently are marked Unassigned.
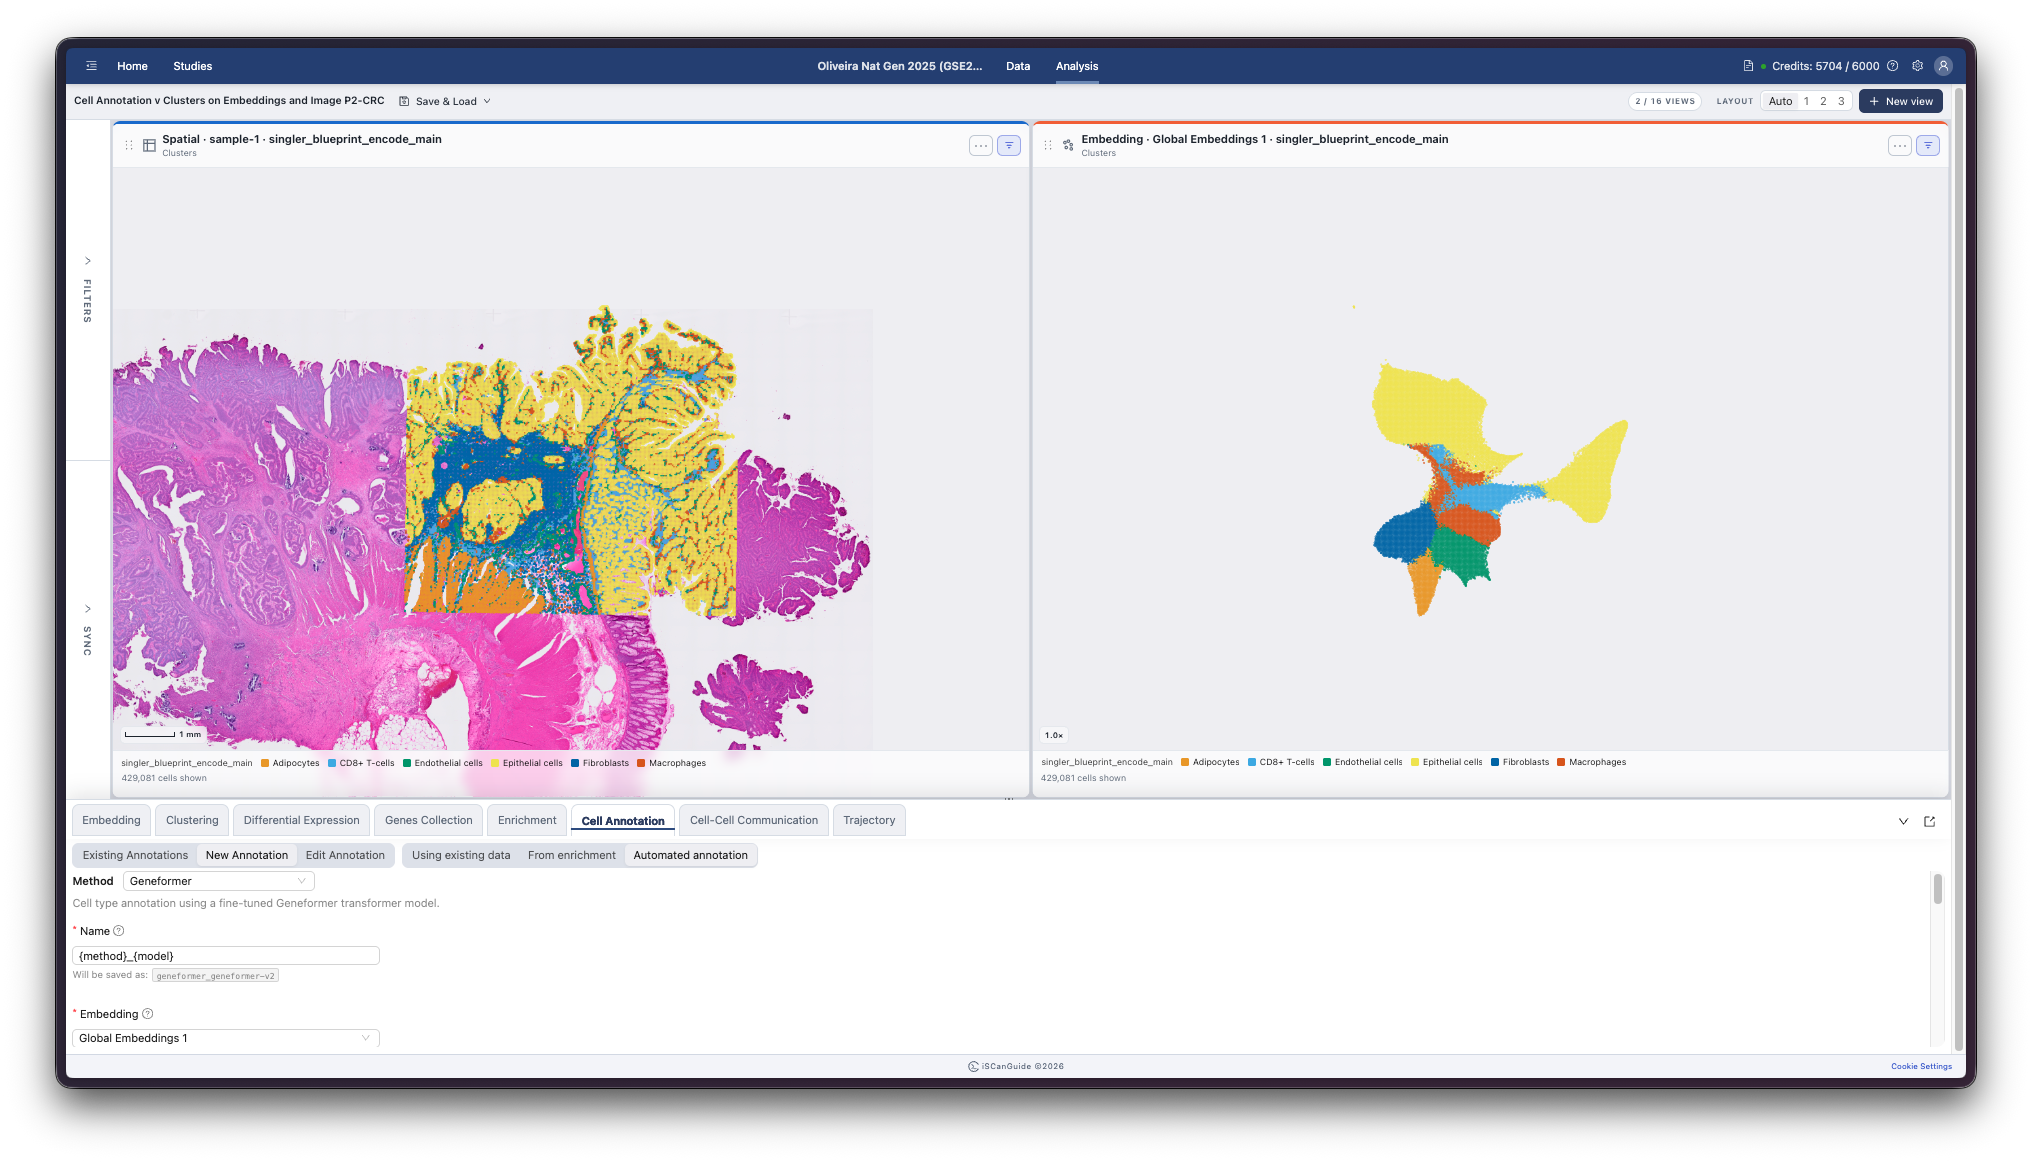
Reference
Each annotation is listed with its Name, the Source it came from, the Samples it covers, and when it was created and last updated.
You can also edit an annotation after it has run. Pick the cells you want to change, type a New value, and apply it. Clustering and metadata columns can be shown alongside to help you decide, which is useful for correcting a handful of cells an automated method got wrong.