Cell-Cell Communication
Shows how to find ligand-receptor interactions between cell types: setting up the analysis, choosing a resource, and reading the results across the tabs.
1Open the Cell-Cell Communication tab
Open Cell-Cell Communication in the bottom drawer. This looks for ligand-receptor pairs whose expression suggests one cell type is signalling to another.
2Start a new analysis
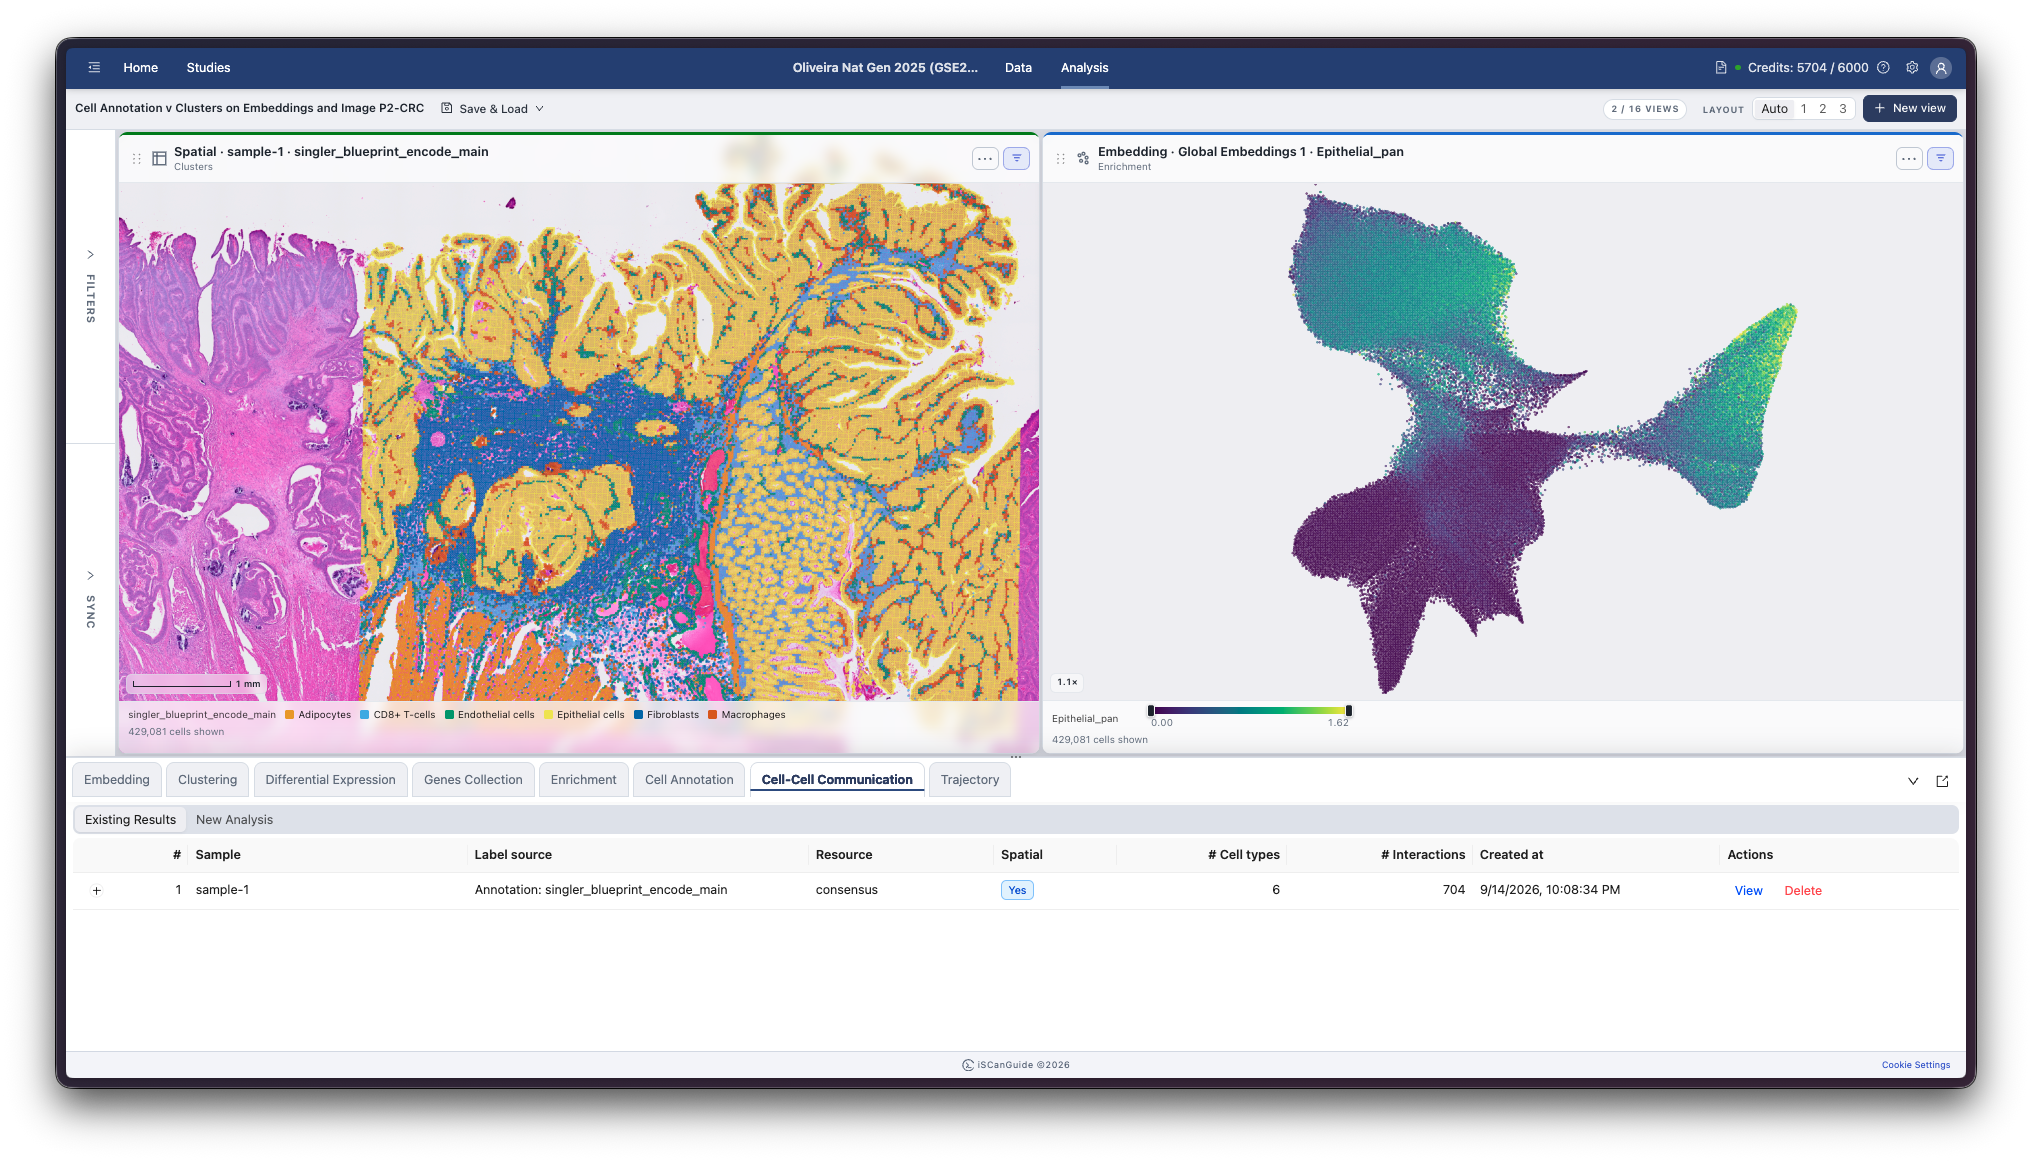
Switch between Existing Results and New Analysis. Existing results stay available, so you can compare runs against different resources.
3Choose a sample
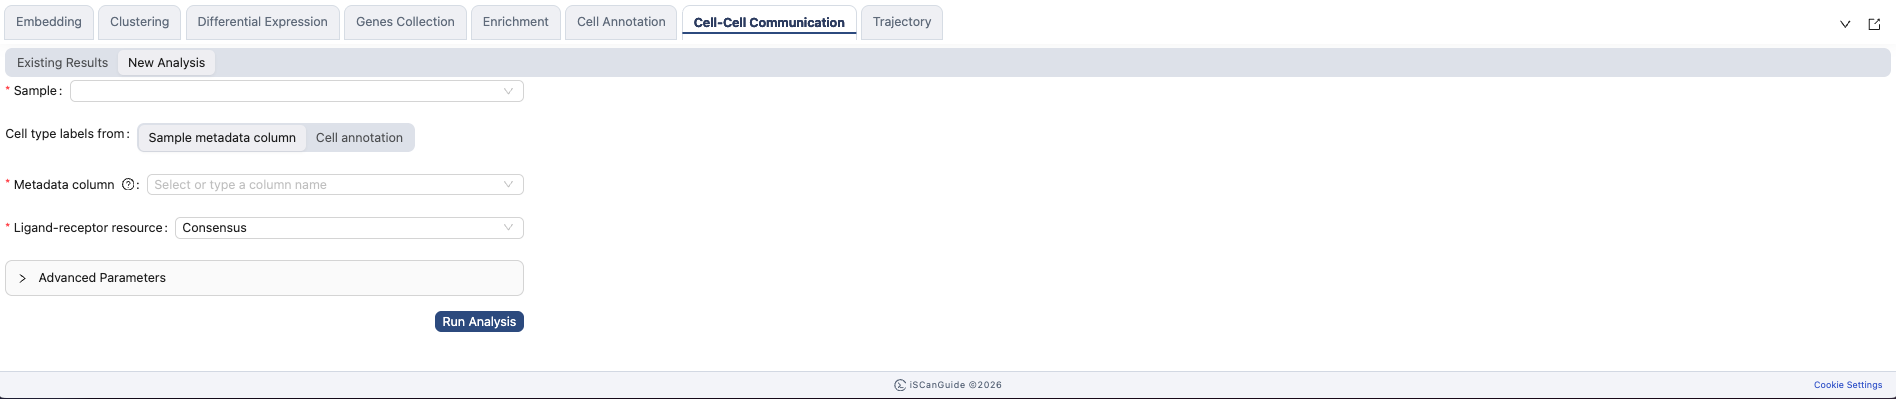
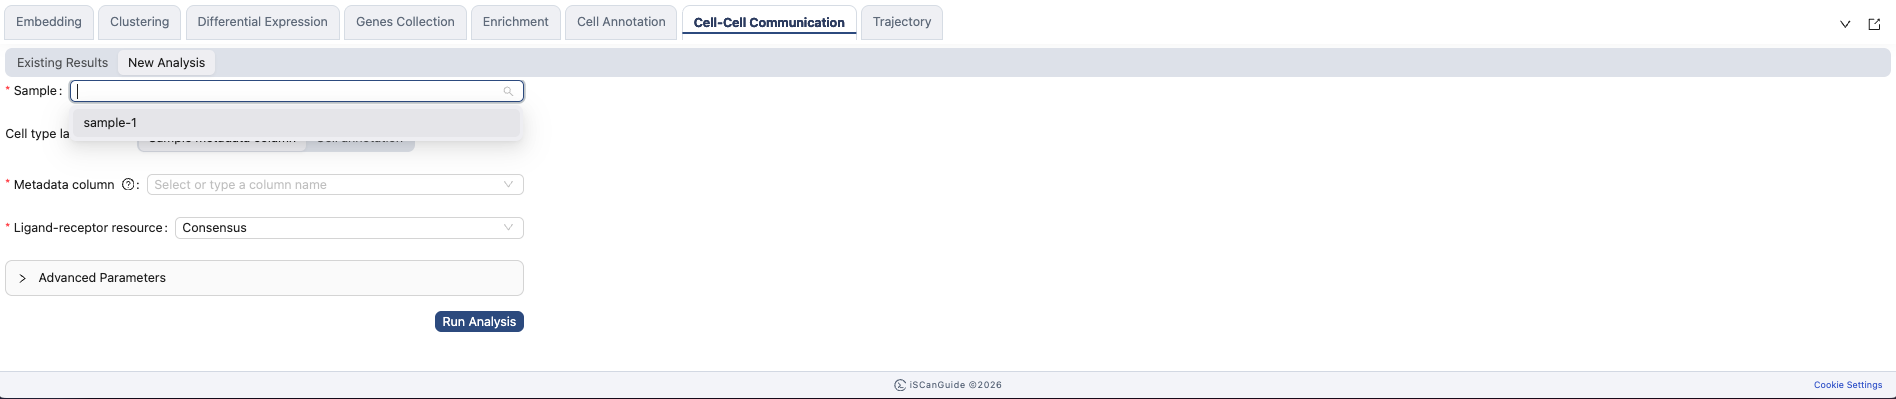
Cell-cell communication runs on one sample at a time. Select the sample to analyse.
Note: if you choose a sample with no spatial data, iSCanGuide warns that it will run in expression-only mode. Predictions then rest on co-expression evidence alone, and the spatial results are not produced. See Spatial co-expression and inflow.
4Choose your cell type labels
Communication is measured between cell types, so tell iSCanGuide where the labels come from: Cell annotation, or a Sample metadata column.
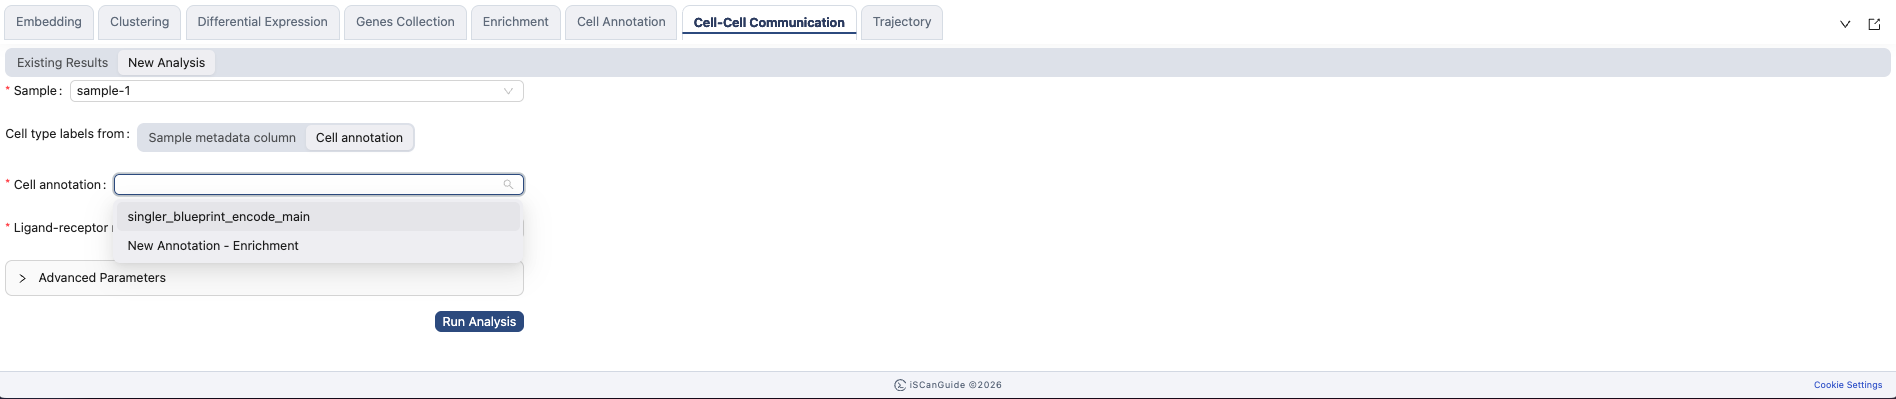
5Choose a ligand-receptor resource
The resource is the reference list of ligand-receptor pairs. Consensus combines several sources and is a reasonable default. Mouse Consensus is its mouse equivalent.
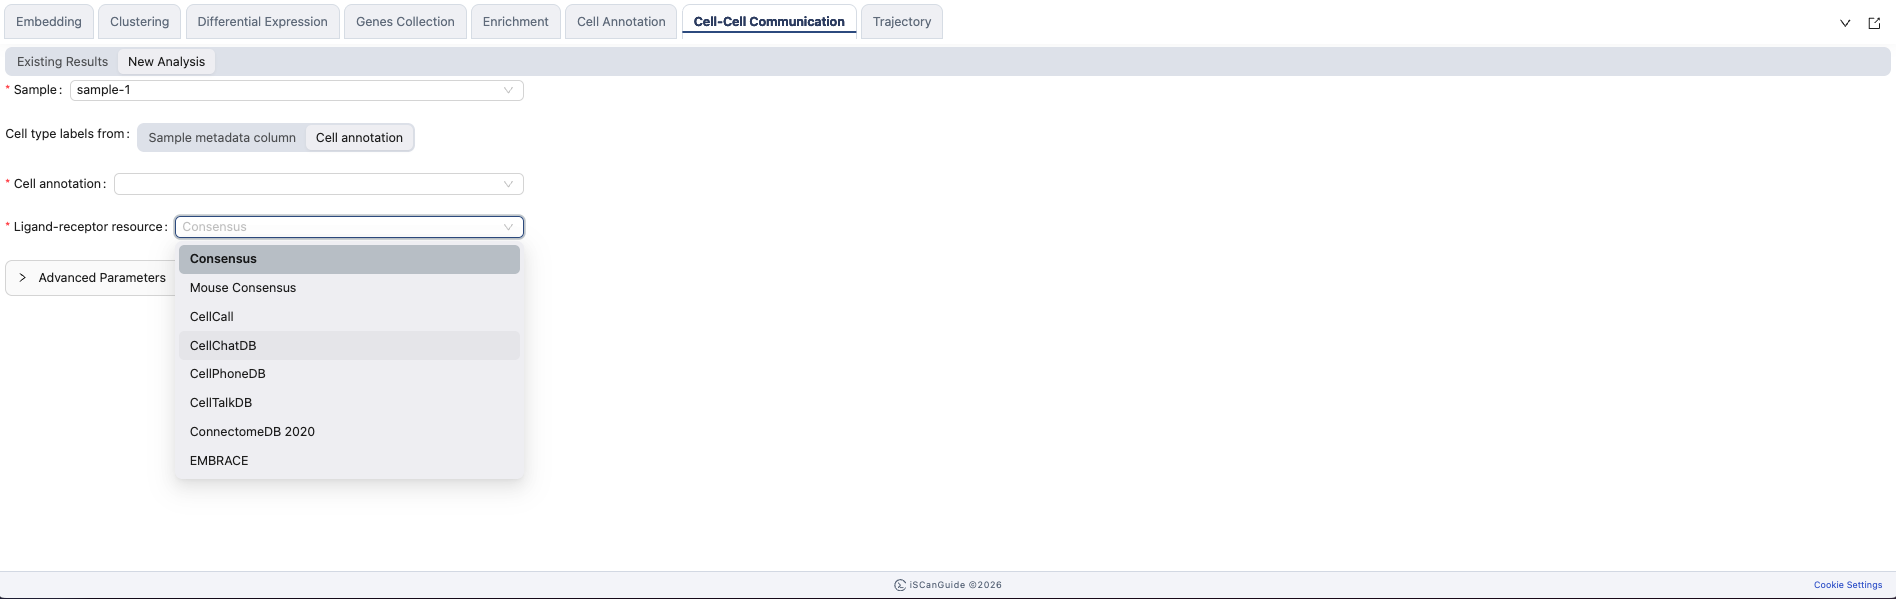
Resources
Consensus, Mouse Consensus, CellCall, CellChatDB, CellPhoneDB, CellTalkDB, ConnectomeDB 2020, EMBRACE, ICELLNET, LRDB, Ramilowski 2015.
6Advanced parameters
The defaults suit most analyses. Expression proportion and Min cells per type control what is included. For non-spatial data, Permutations sets how p-values are estimated. For spatial data, Spatial bandwidth defines what counts as a neighbour.
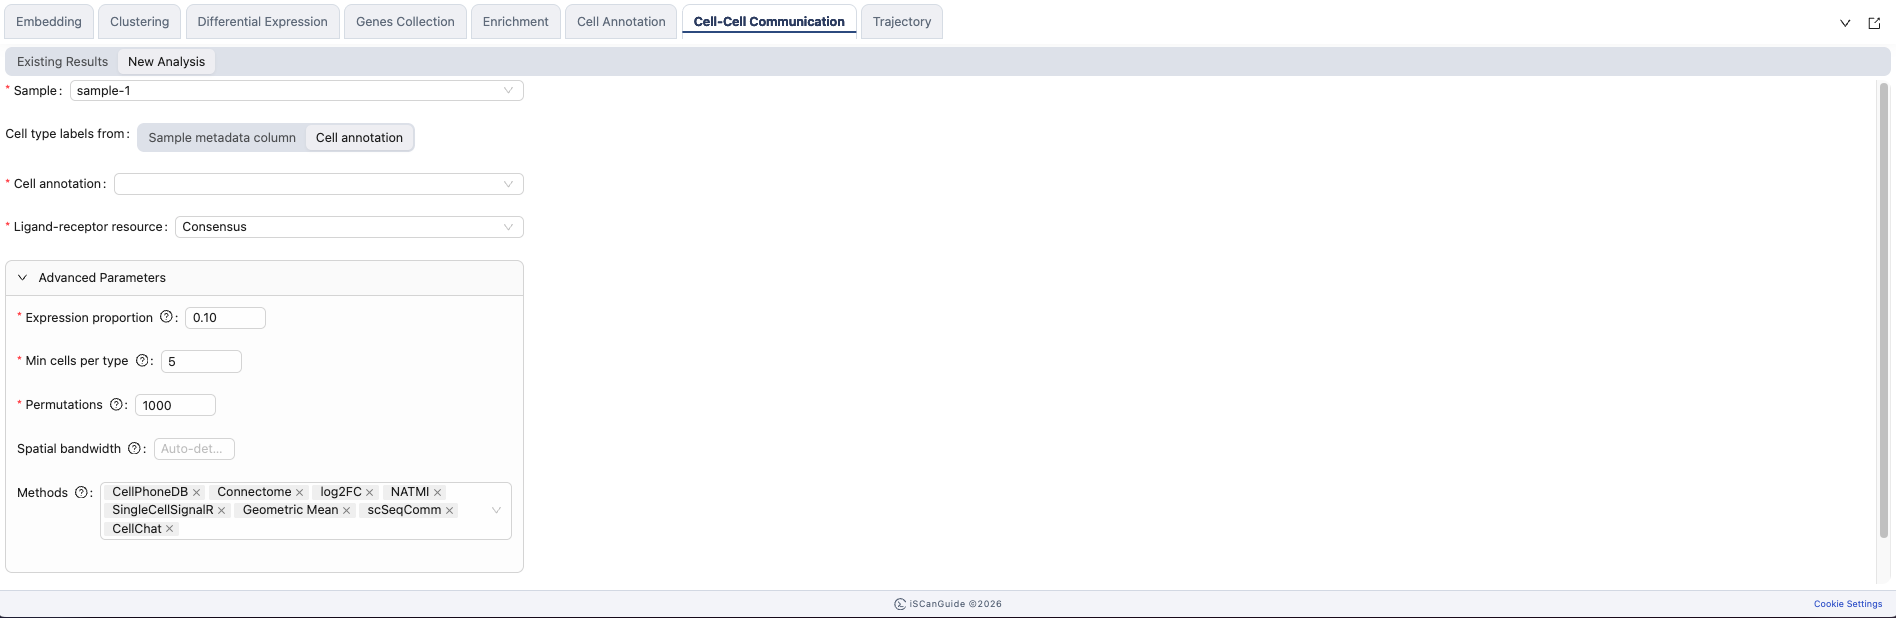
Parameters
| Field | What it does |
|---|---|
Expression proportion | Minimum fraction of cells expressing a gene for it to be included, 0–1 |
Min cells per type | Minimum number of cells required in a cell type |
Permutations | Number of permutations for p-value estimation. Non-spatial only |
Spatial bandwidth | Gaussian kernel bandwidth for spatial neighbours. Spatial only. Leave blank to auto-detect |
Methods | Scoring methods included in the rank aggregate. Leave empty for the defaults |
7Open a result
Completed analyses are listed under Existing Results, with the sample, resource and label source each one used, and how many cell types and interactions it found. Click View to open a result in its own window.
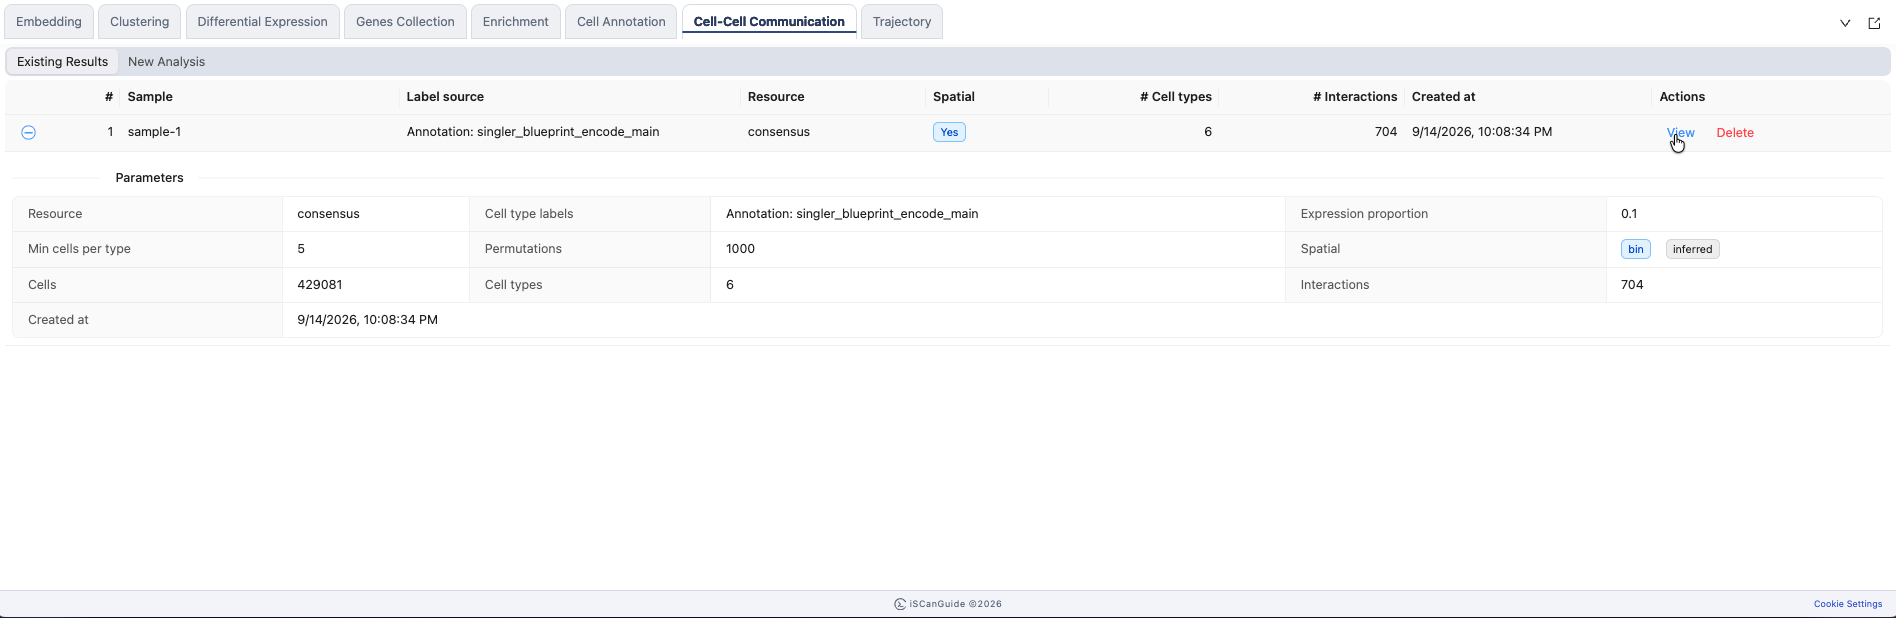
Reference
Each row records the Sample, Label source, Resource, whether the run was Spatial, # Cell types, # Interactions and Created at. A result can also be deleted from here.
8Cell Type Pairs
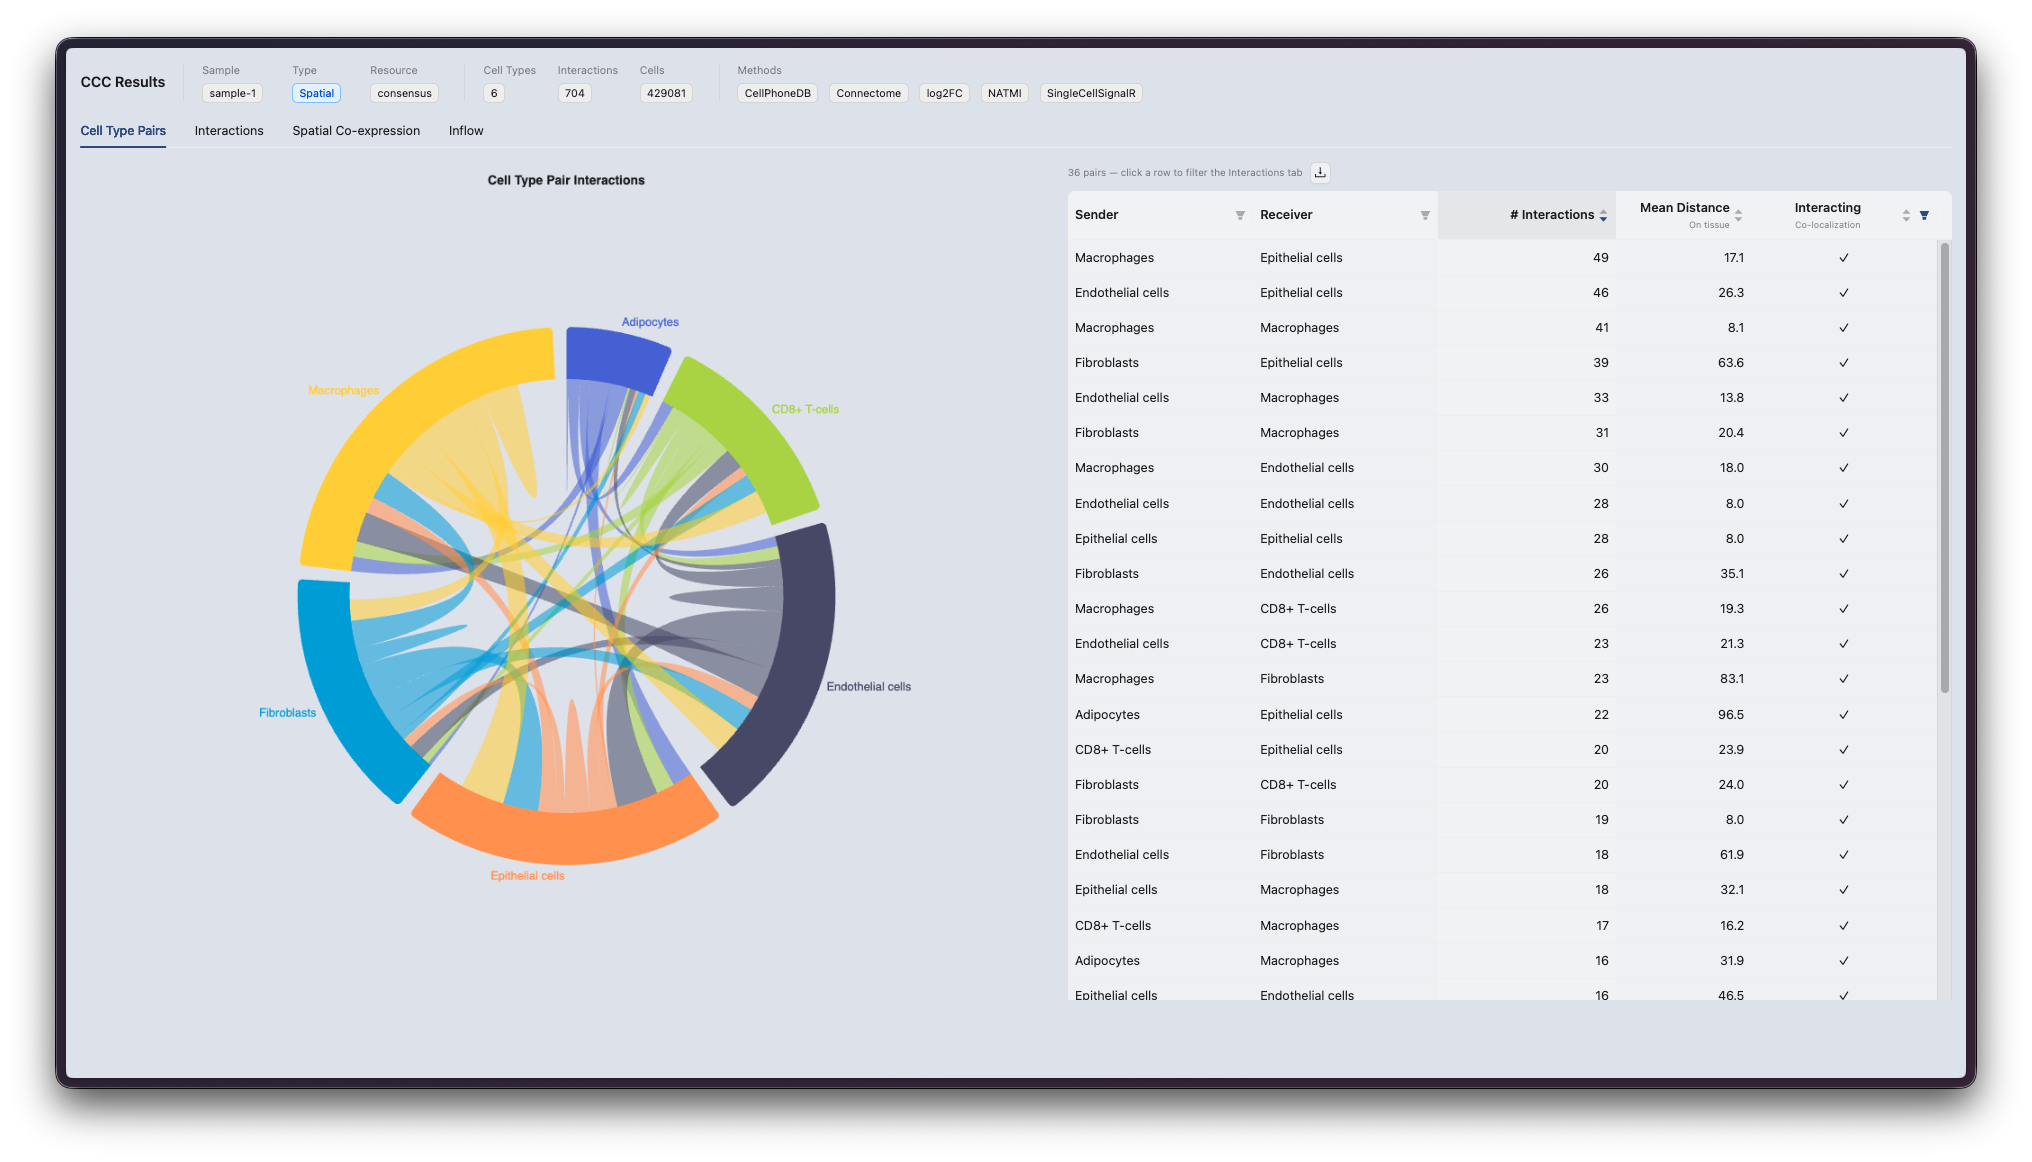
Cell Type Pairs shows which cell types are signalling to which. Start here to find the pairs worth looking at in detail.
9Interactions
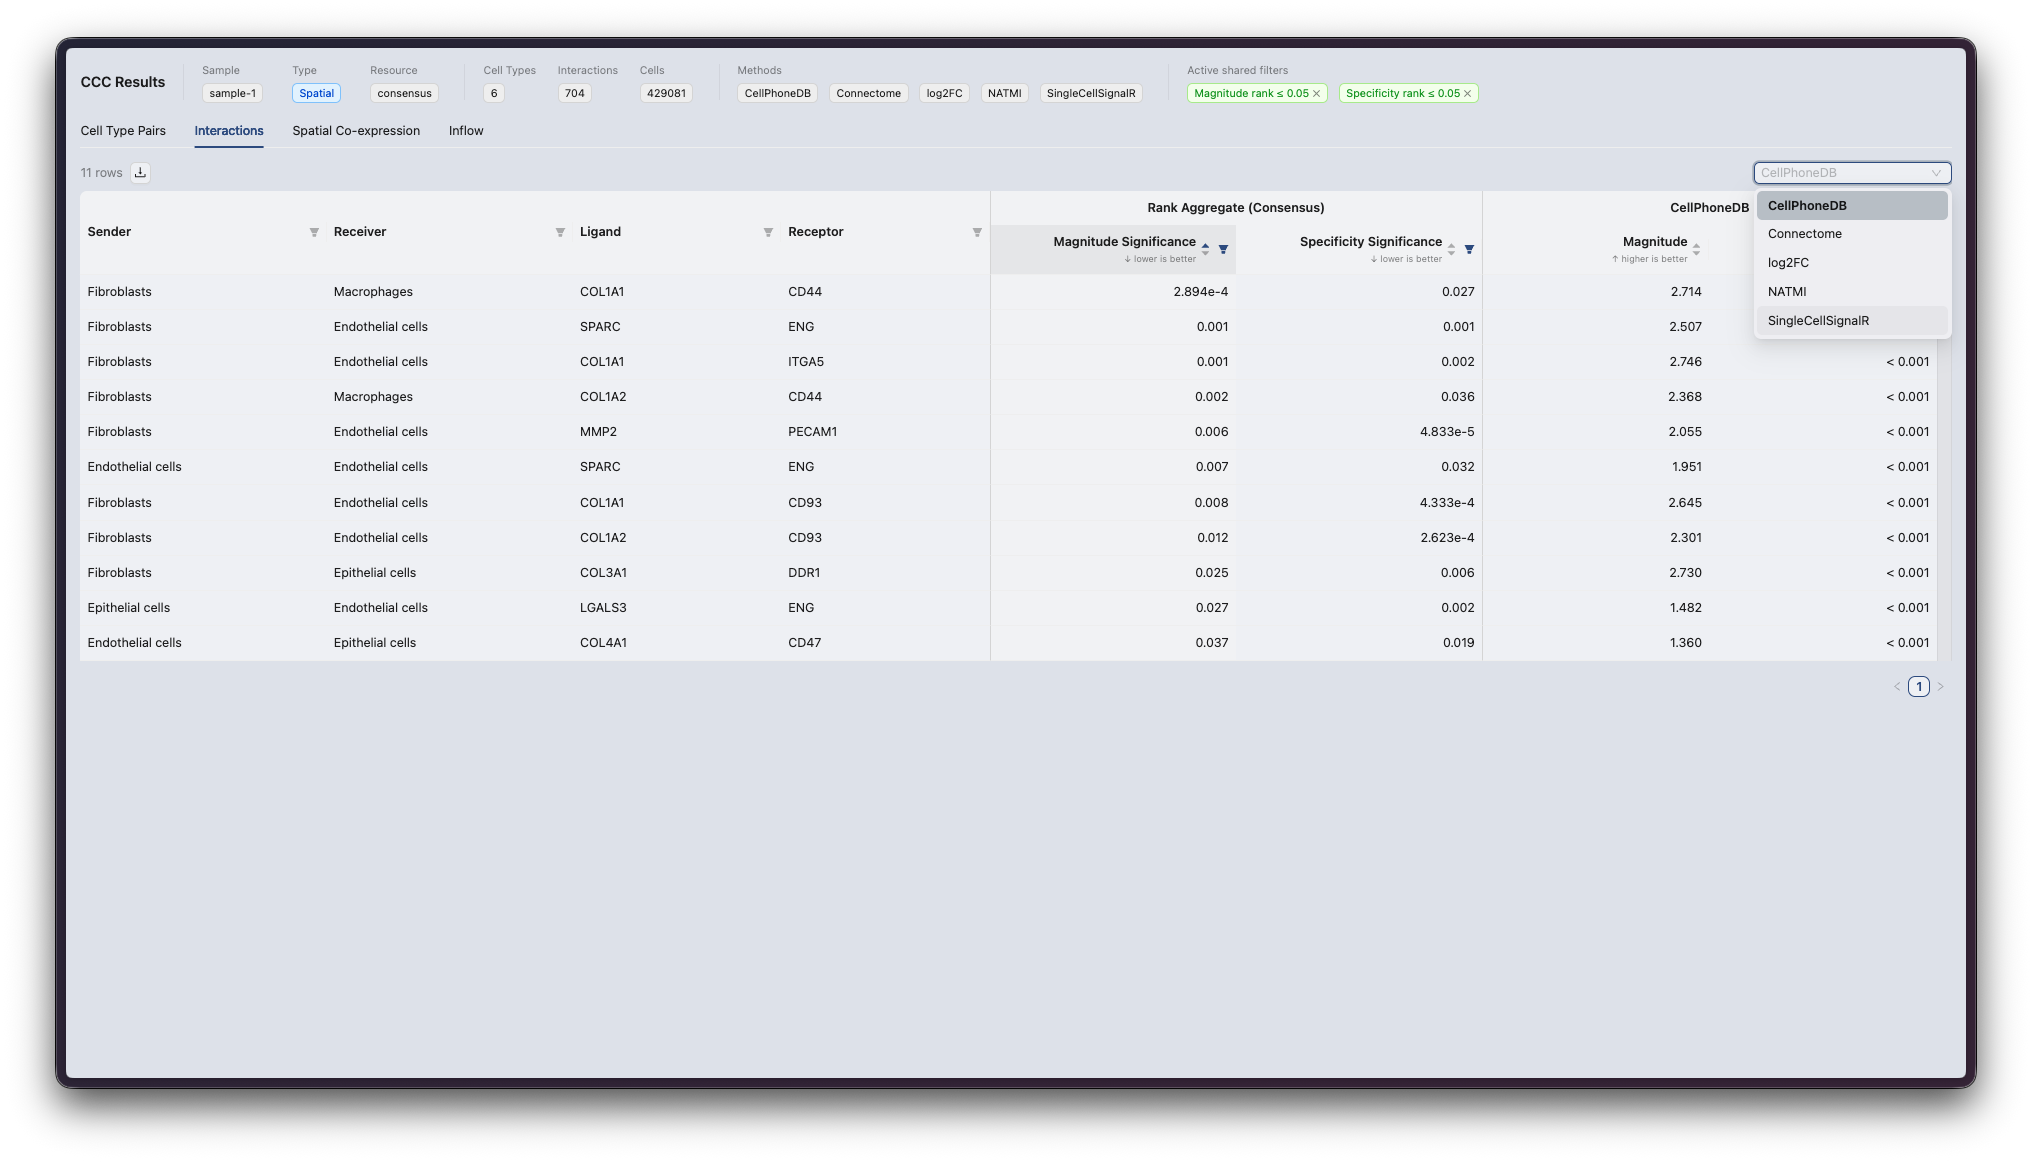
Interactions lists the individual ligand-receptor pairs behind a cell type pair, with their magnitude and specificity ranks. Filter by rank to focus on the strongest.
10Chord plot
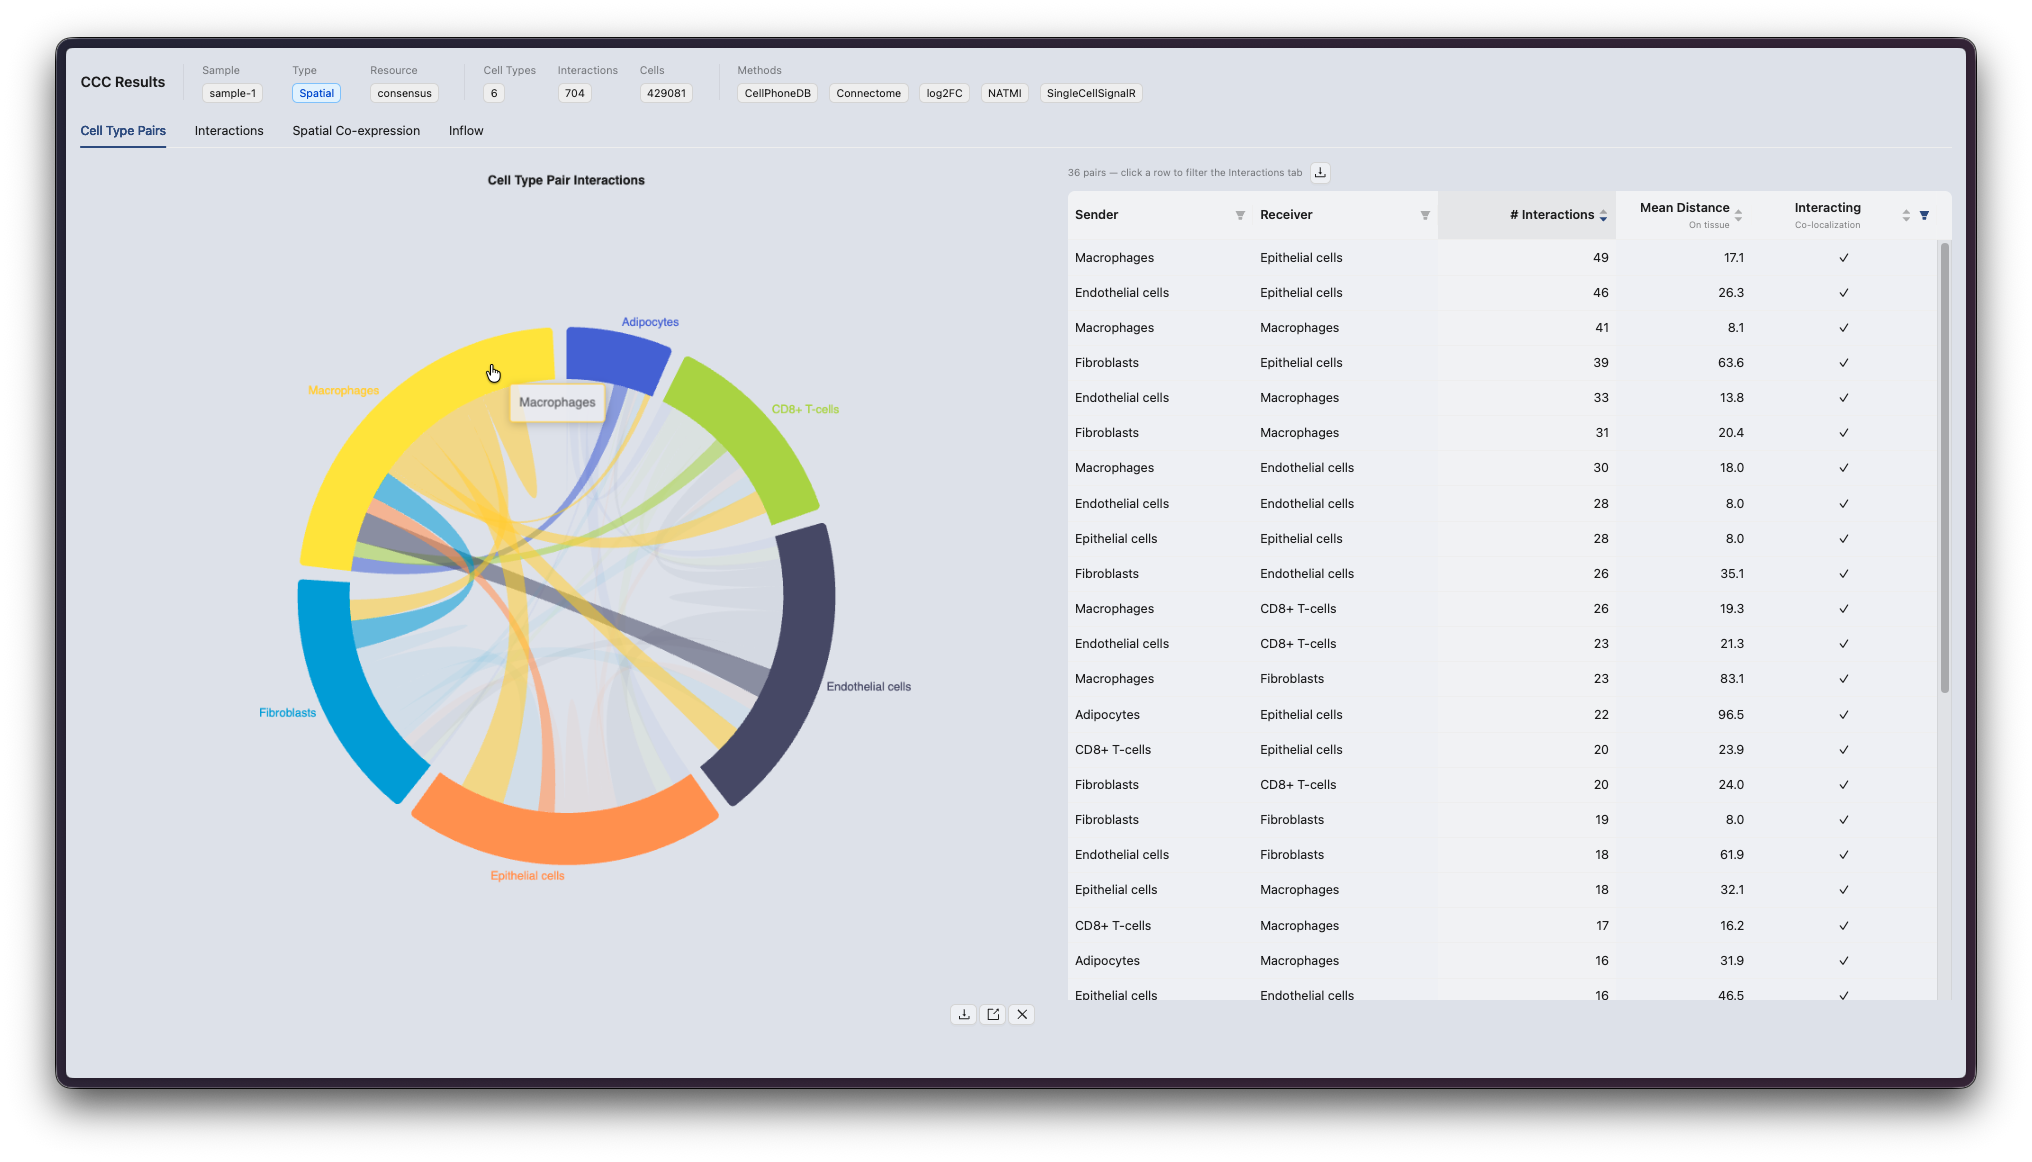
The chord plot shows the communication between cell types as a whole, with each ribbon a flow between two types.
11Spatial co-expression and inflow
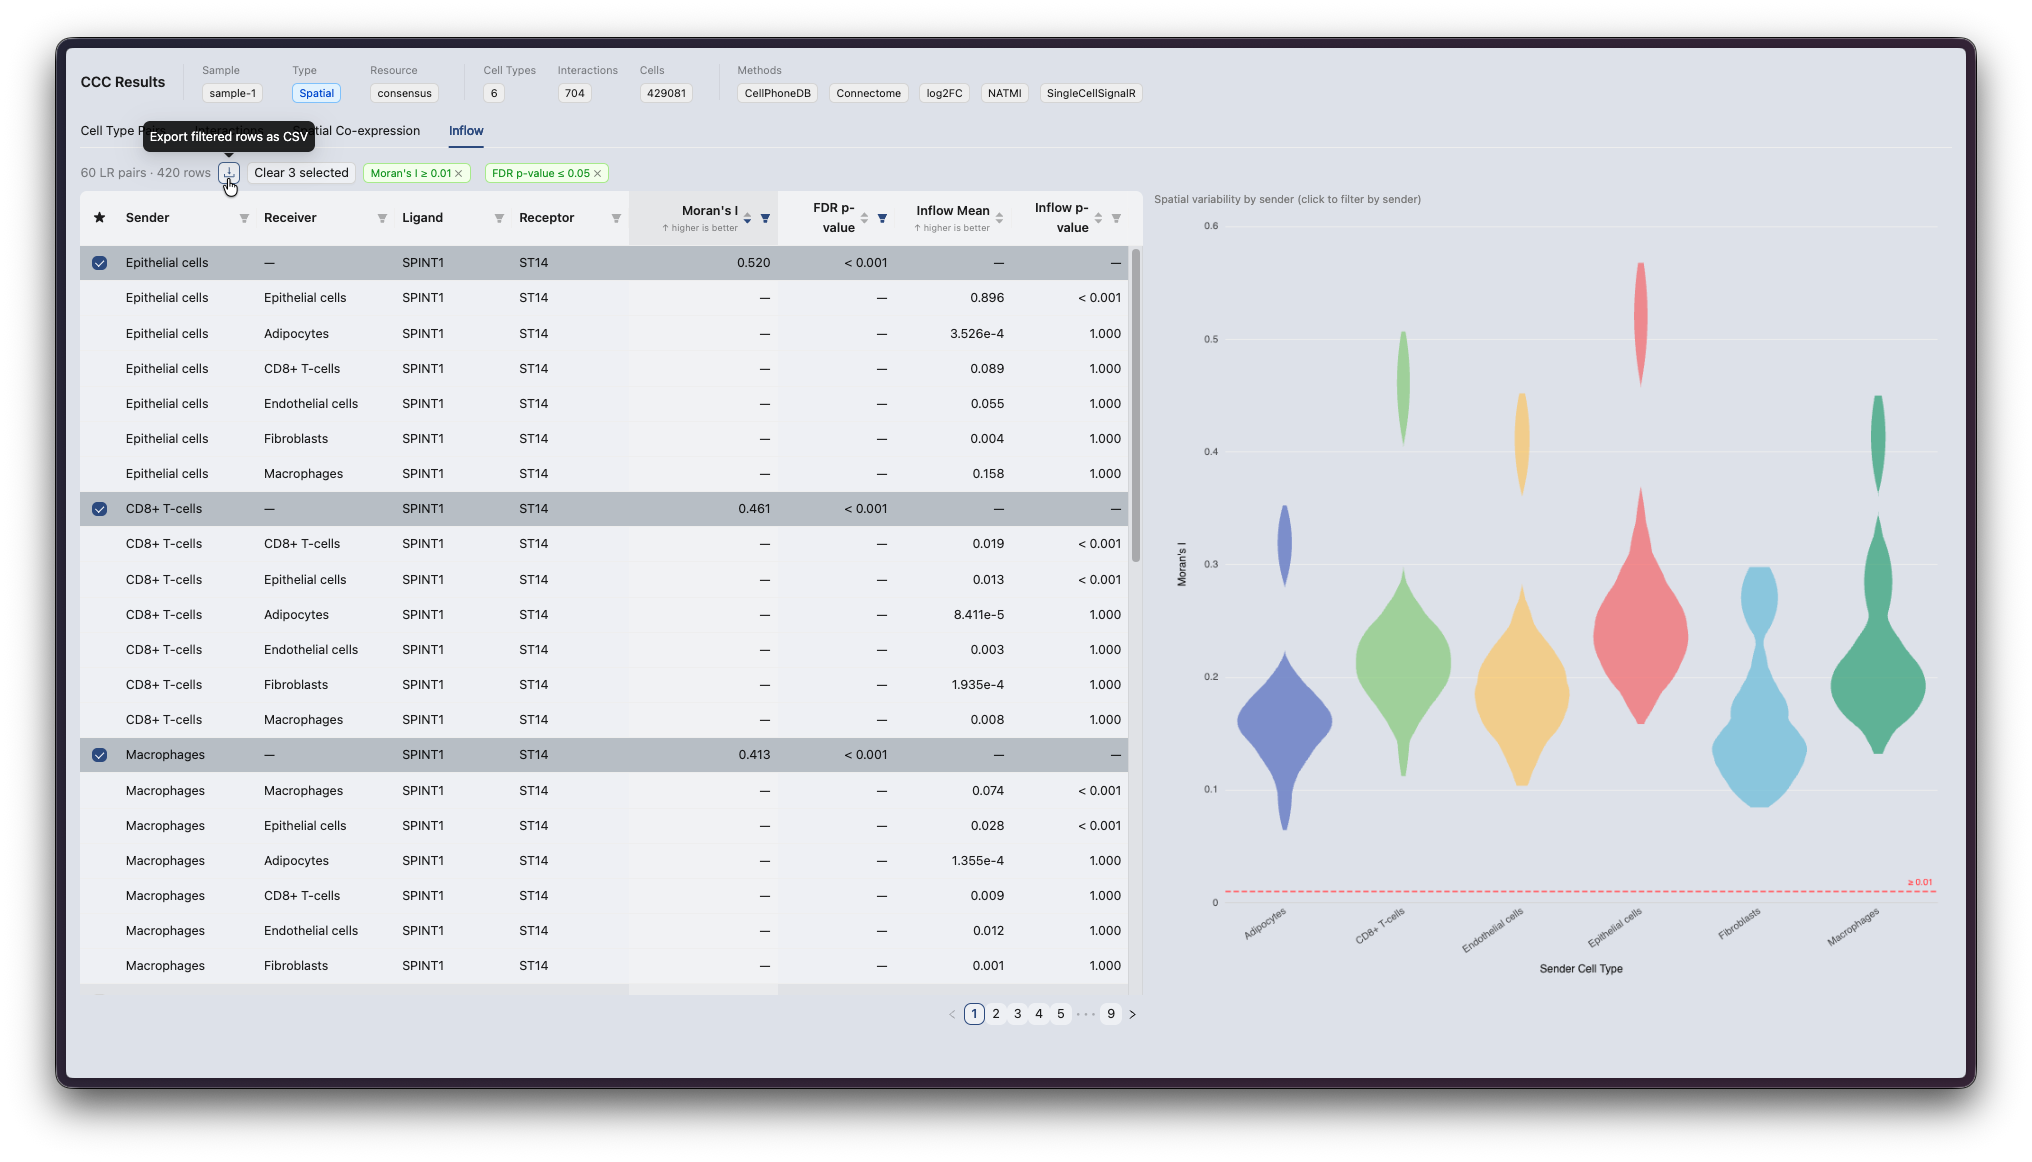
For spatial data, Spatial Co-expression shows where ligand and receptor are expressed together on the tissue, and Inflow summarises the signalling each cell type receives. Tick a row in either tab to shortlist it. Shortlisted results move to the top of the colour-by list when you view them on the tissue, and stay ticked until you untick them.
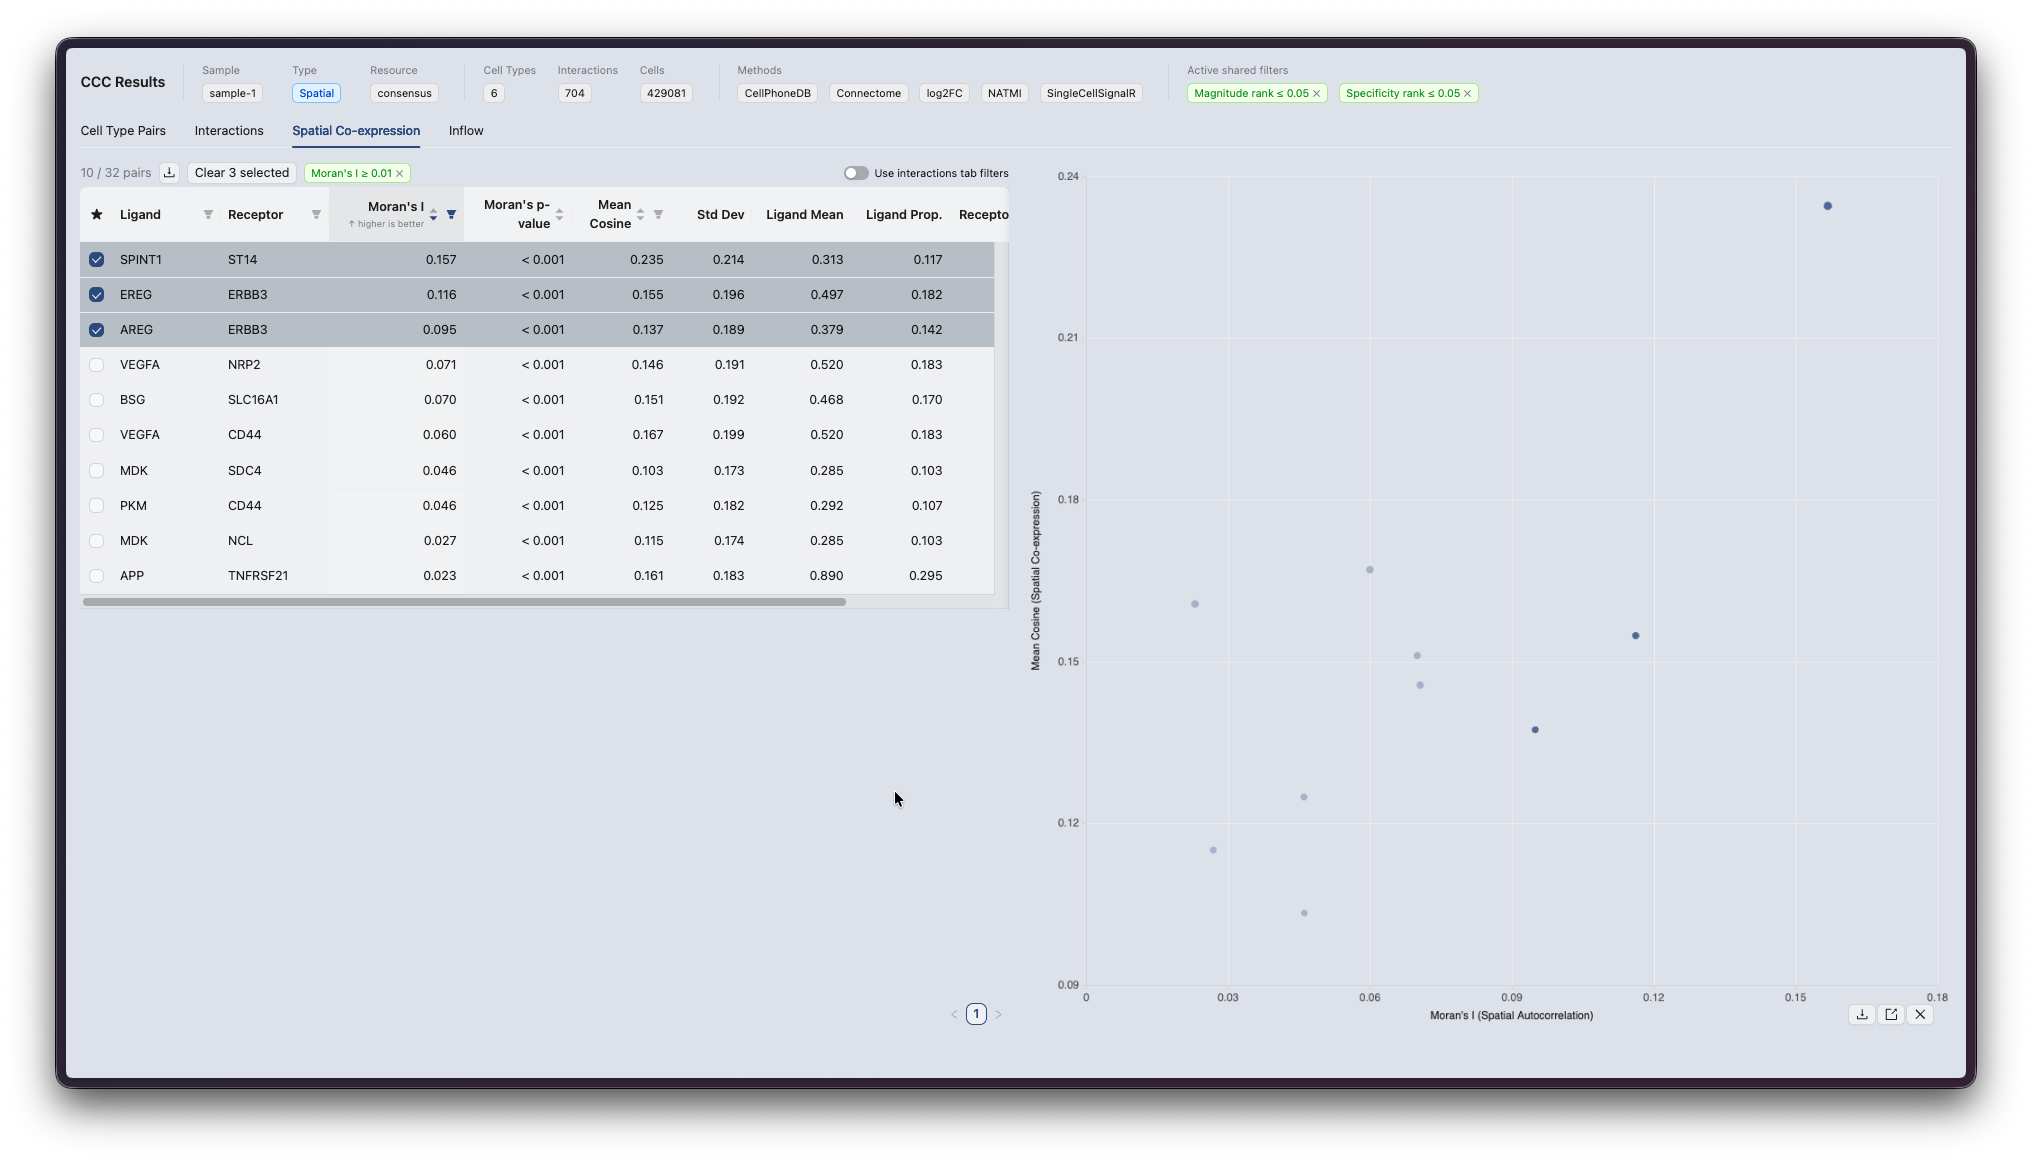
Note: in Inflow, only the interaction rows can be shortlisted. The receiver rows beneath one are part of that interaction rather than separate results.
Note: these results are produced only for spatial samples. A non-spatial run returns interactions but no co-expression or inflow tables, which is what the expression-only warning on the form is telling you.
12See the results on the tissue image
Communication results can be drawn on the tissue itself. On the analysis page, create a view and choose Spatial as the plot type, then the embedding and the samples you want. Set the data source to Cell-Cell Communication, pick the output you want to see, and add the view. Anything you shortlisted sits at the top of the list.
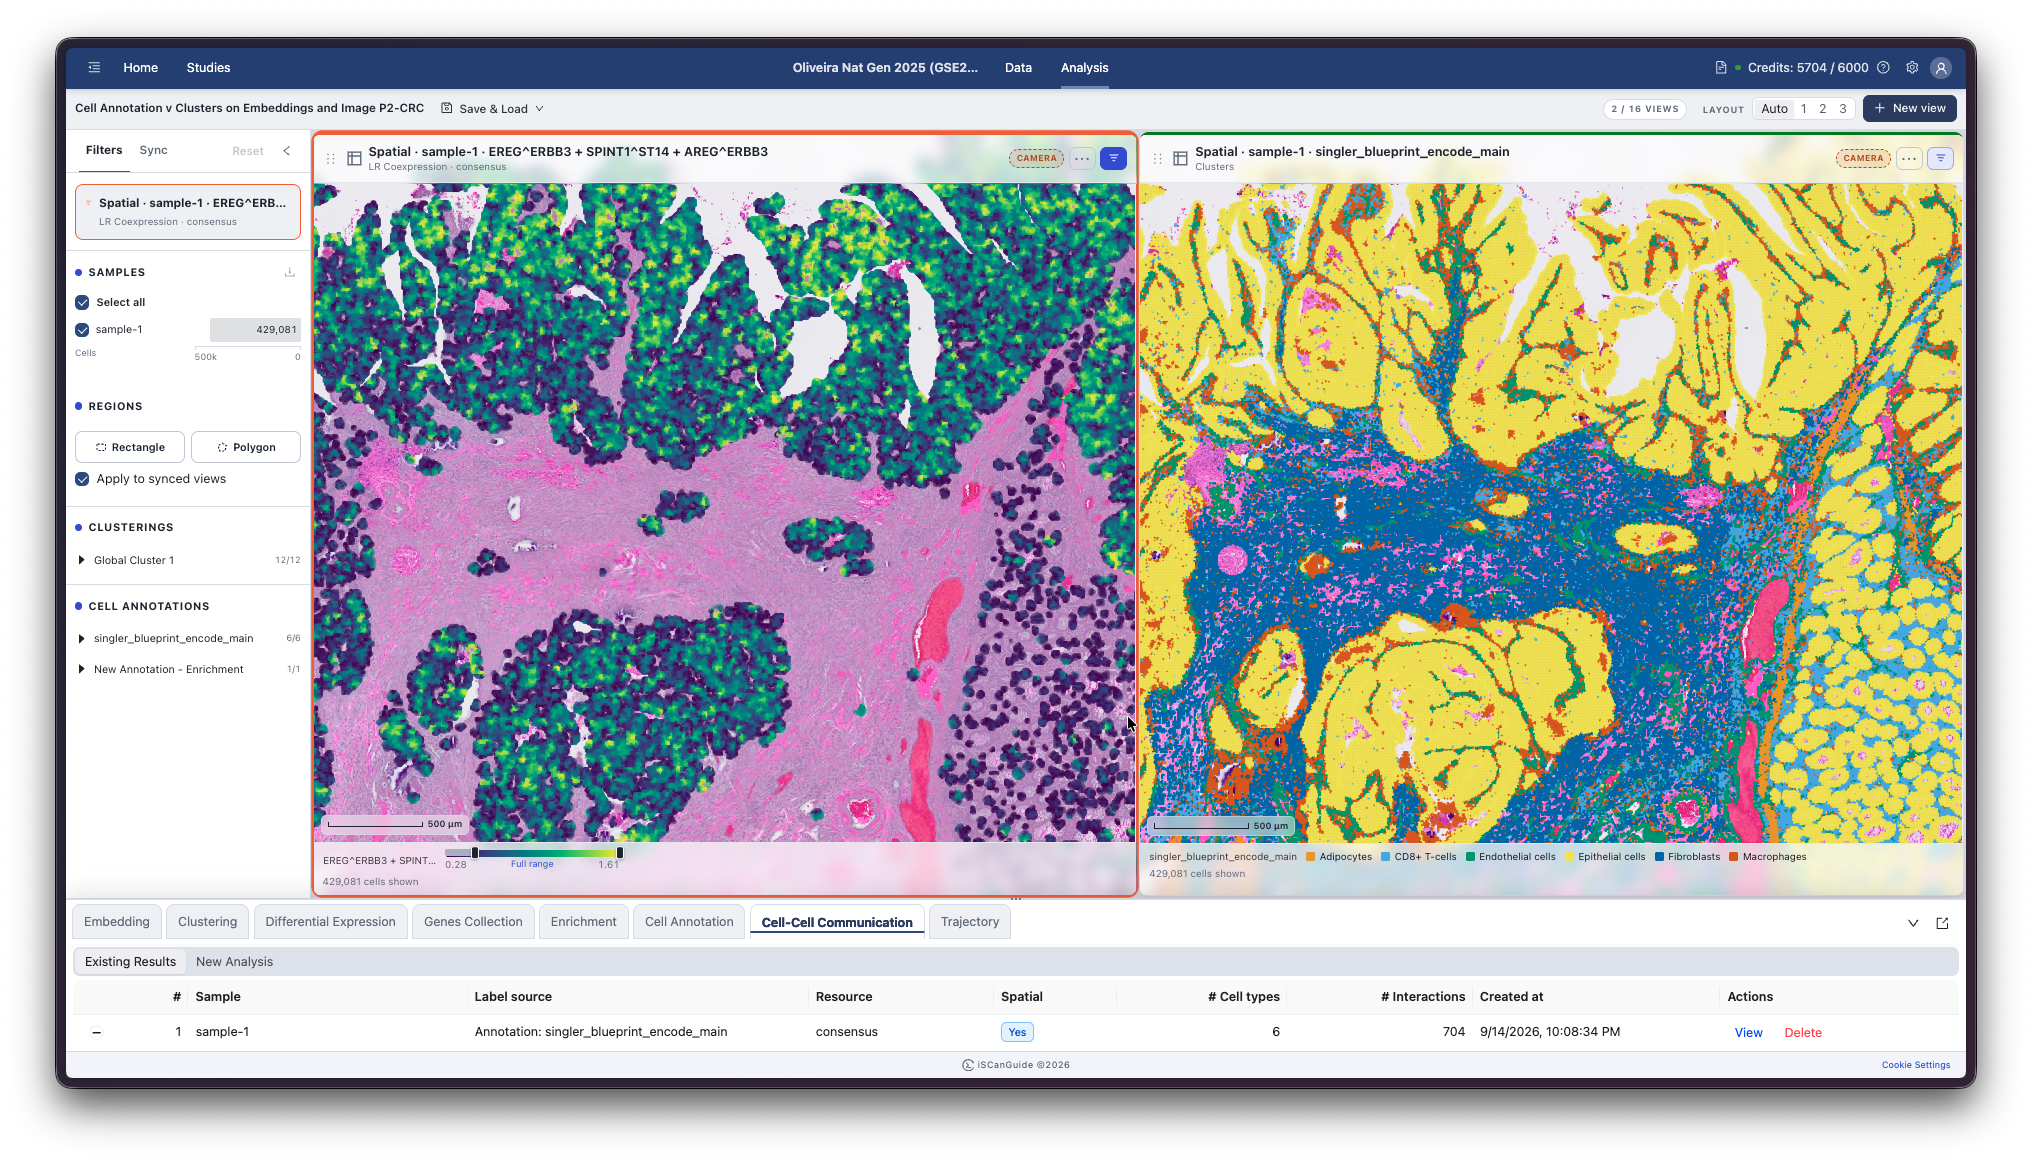
Note: this works on the sample the analysis was run against. Communication results are not available on an embedding view.
13Export results
Click Run Analysis to start. Every results tab exports to CSV, filtered as you have it on screen.