Clustering
Shows how to group cells by expression similarity: choosing an embedding and a method, setting the parameters, and using the clusters in the rest of the app.
1Open the Clustering tab
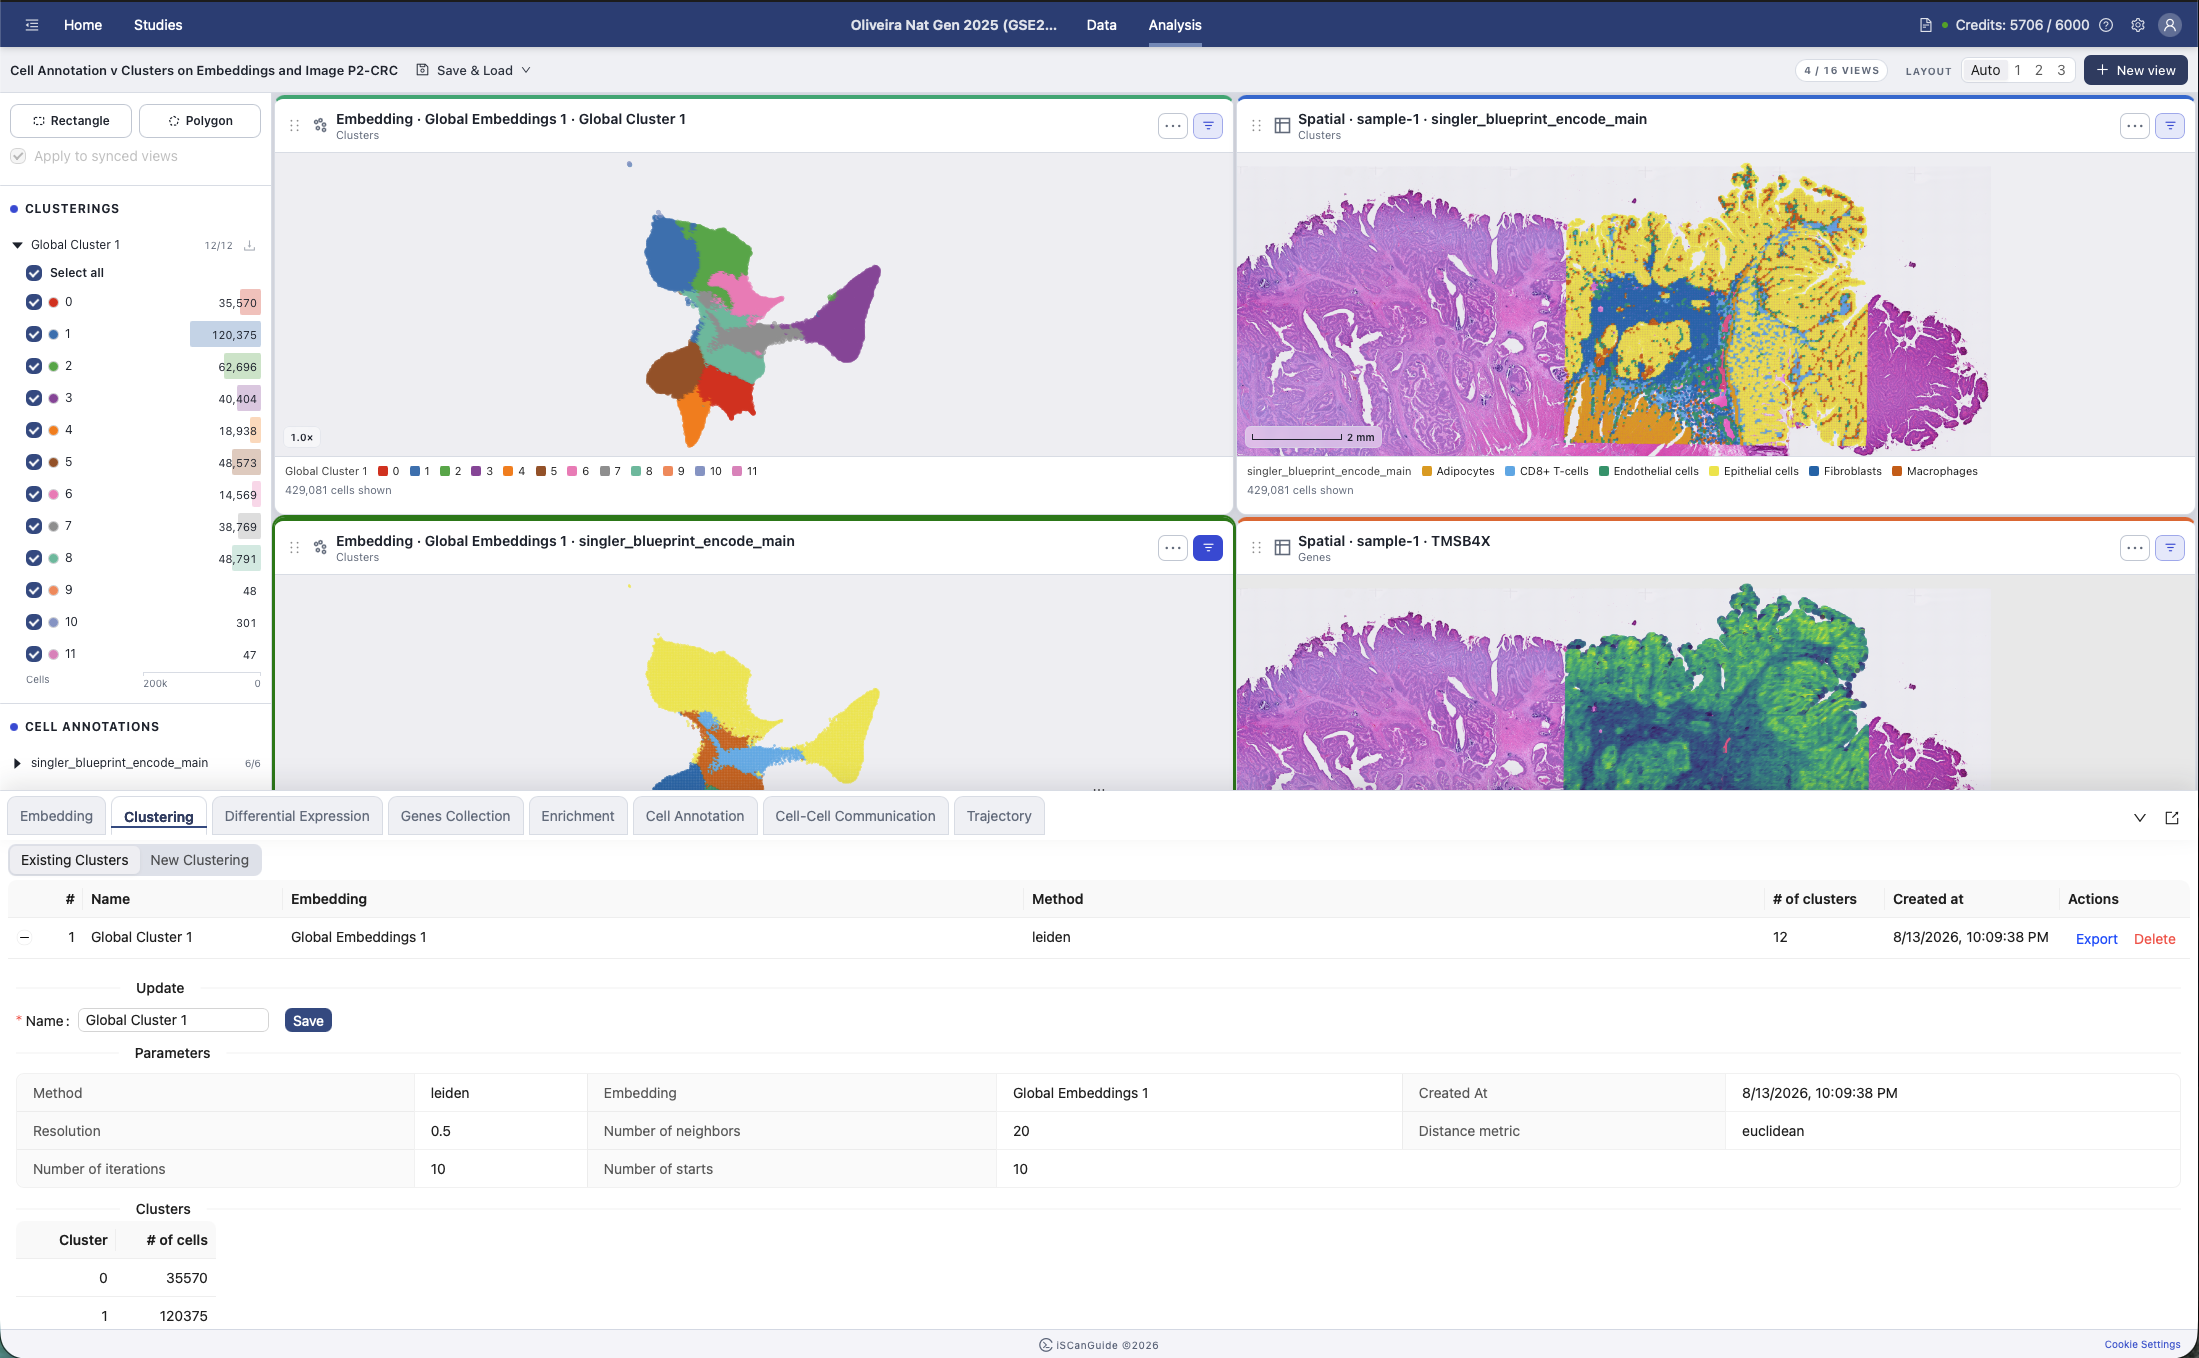
Open Clustering in the bottom drawer. Clustering groups cells with similar expression profiles, and those groups become the basis for annotation and differential expression.
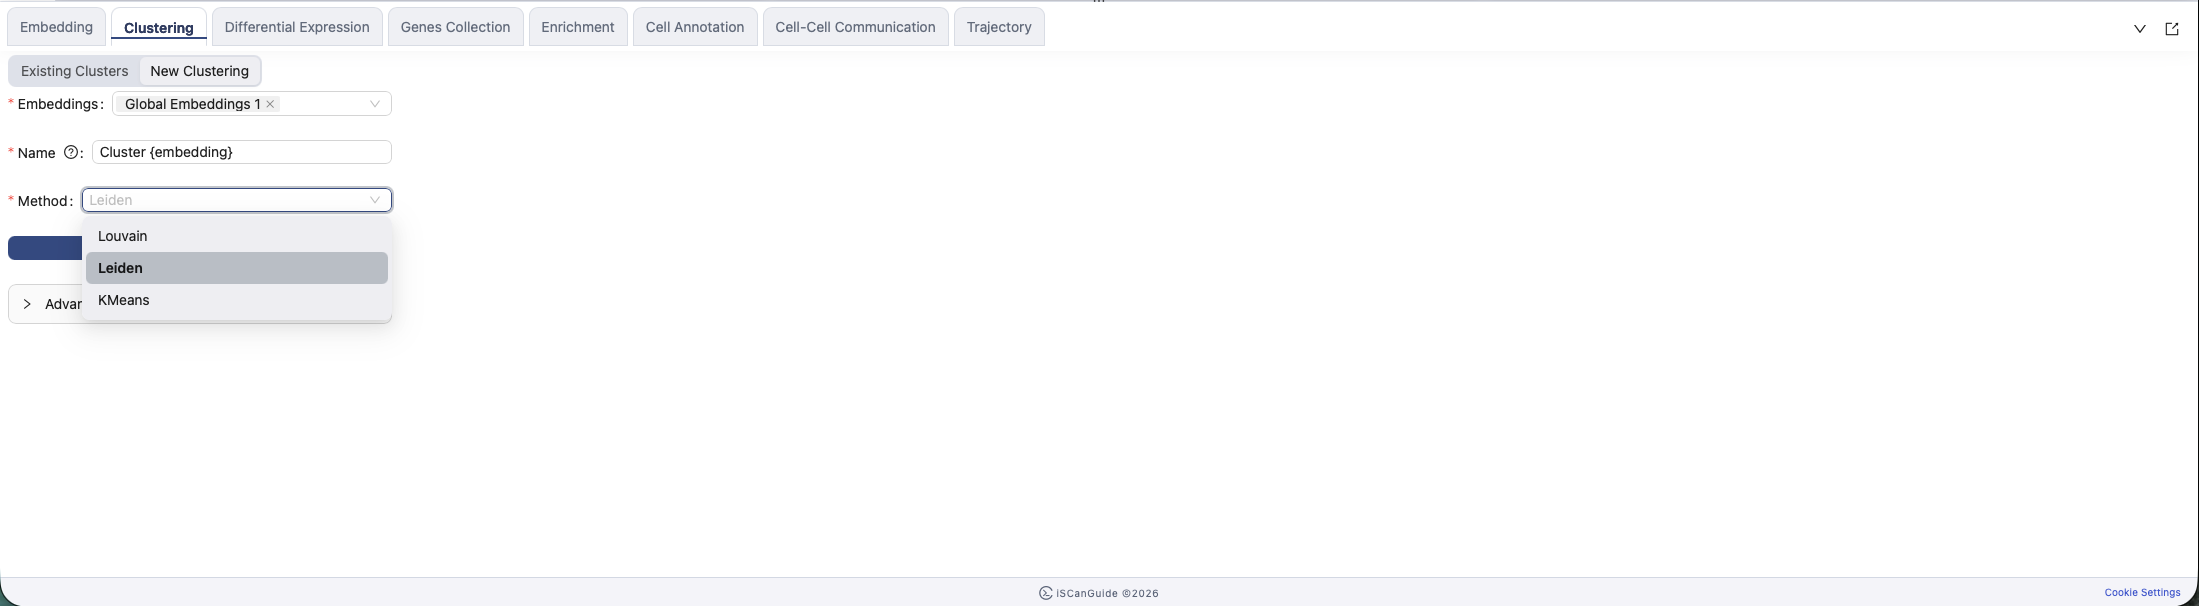
2Choose an embedding
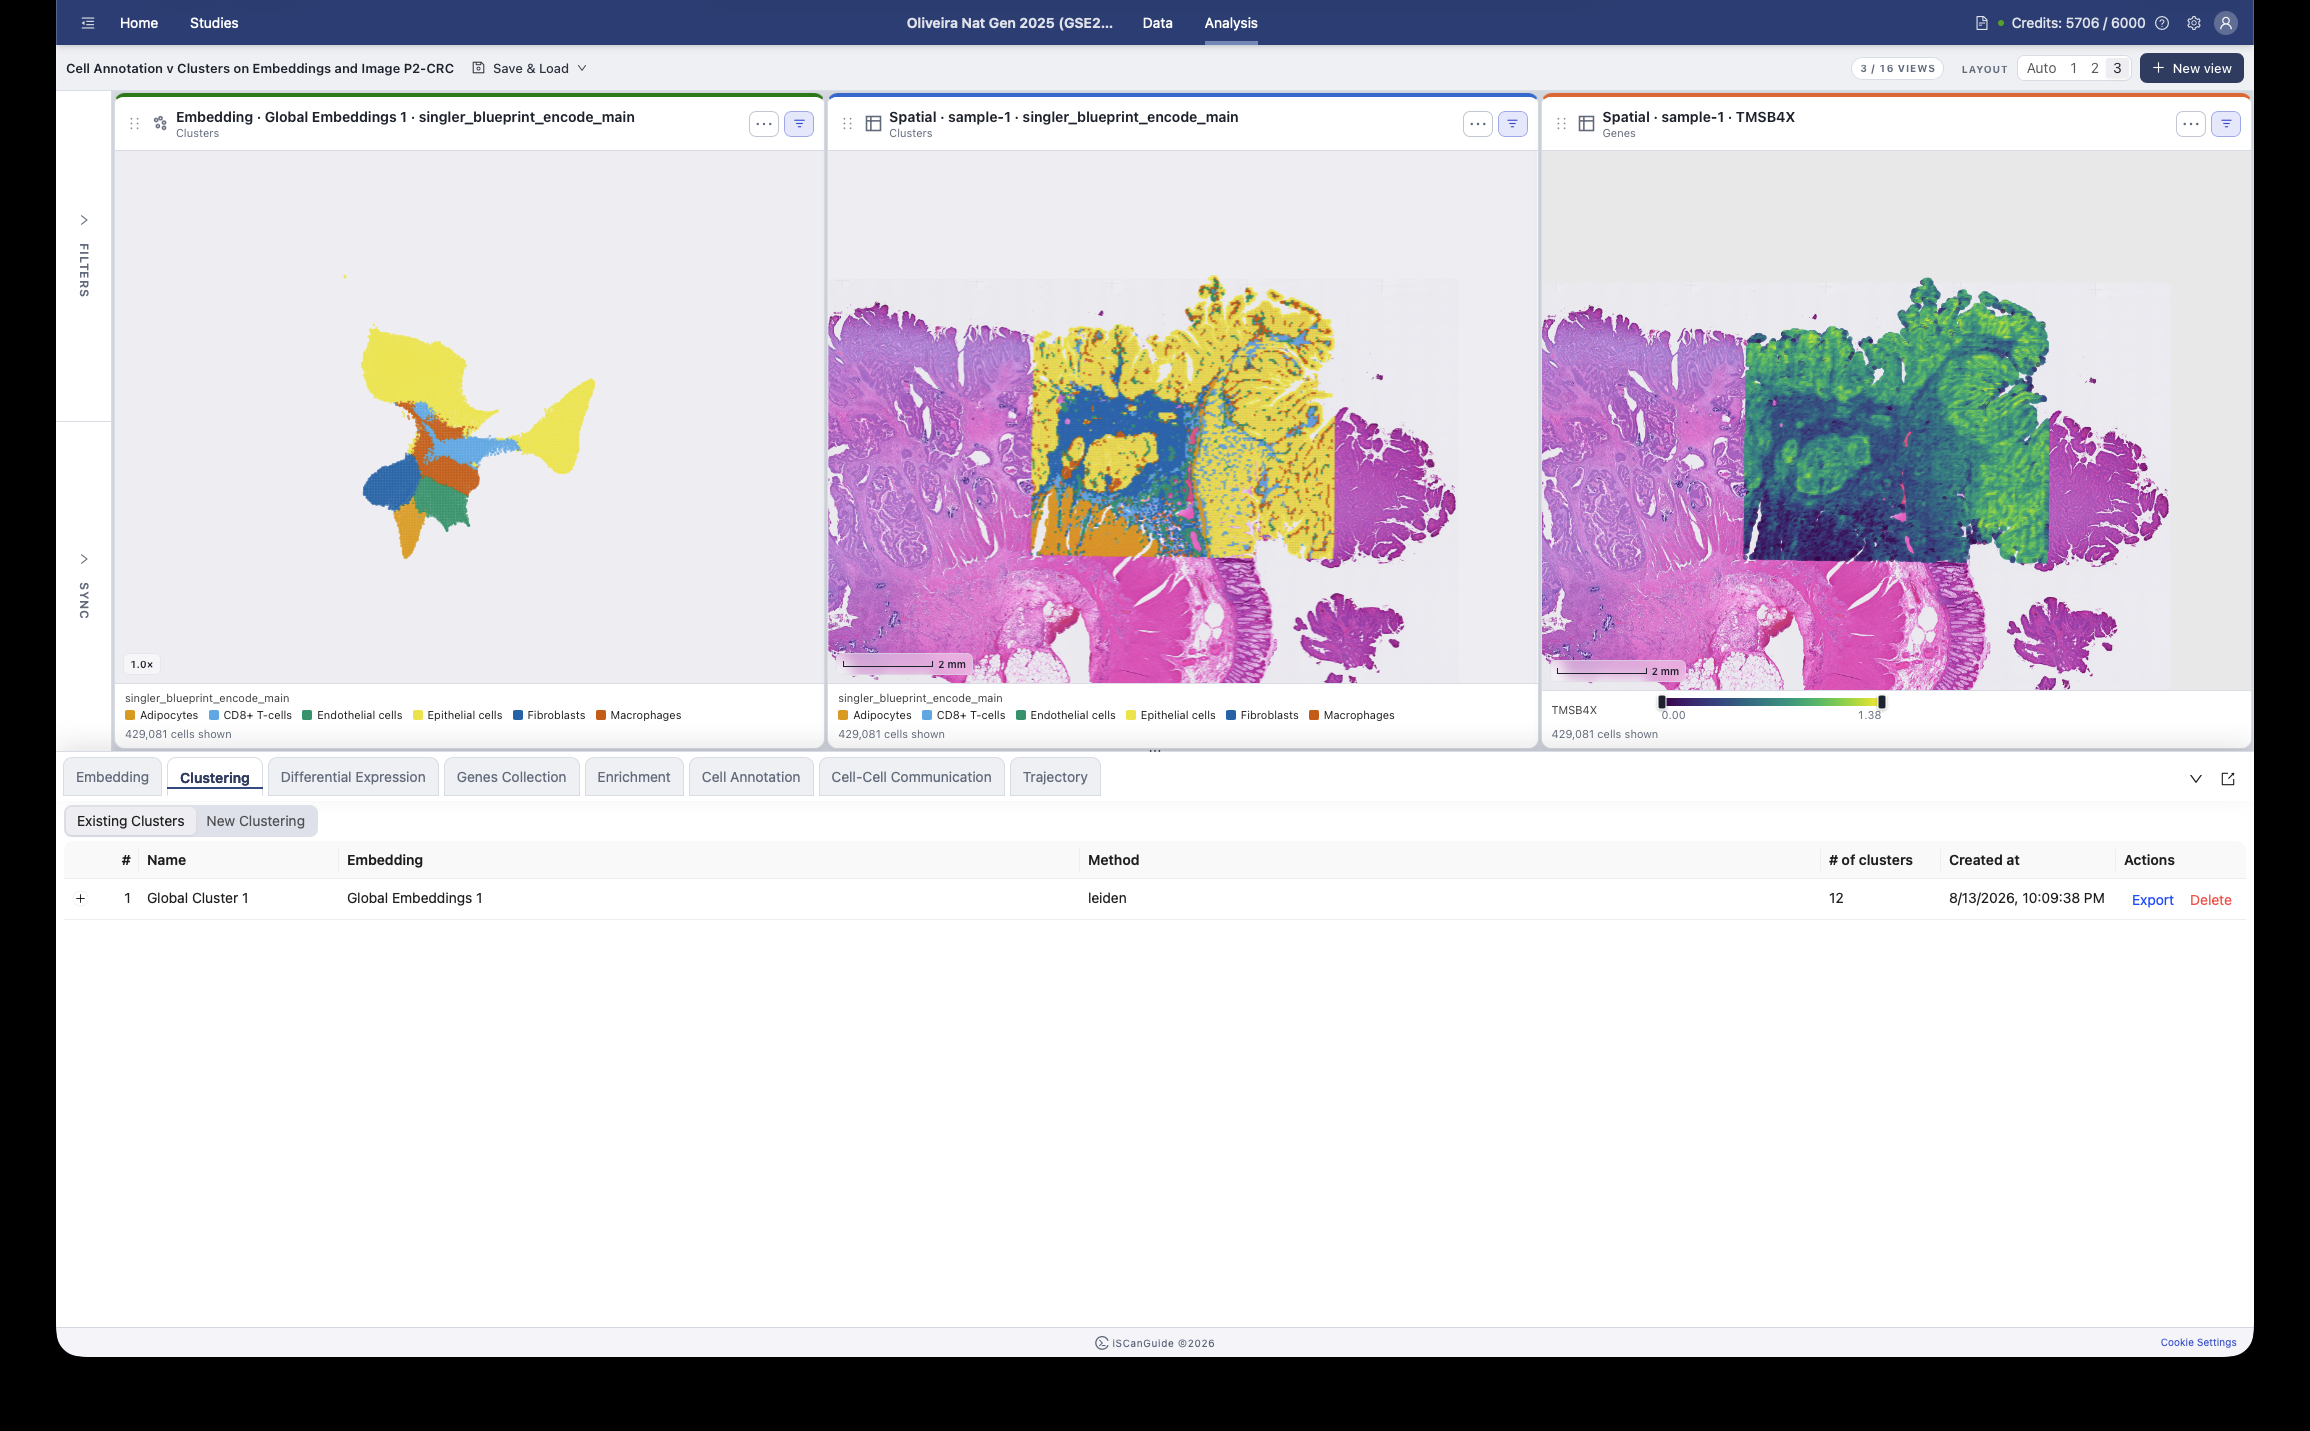
Select the embeddings to cluster. You can pick more than one and cluster them in a single run. Clustering uses each embedding's higher-dimensional representation, not the two-dimensional plot you see.
3Name the clustering
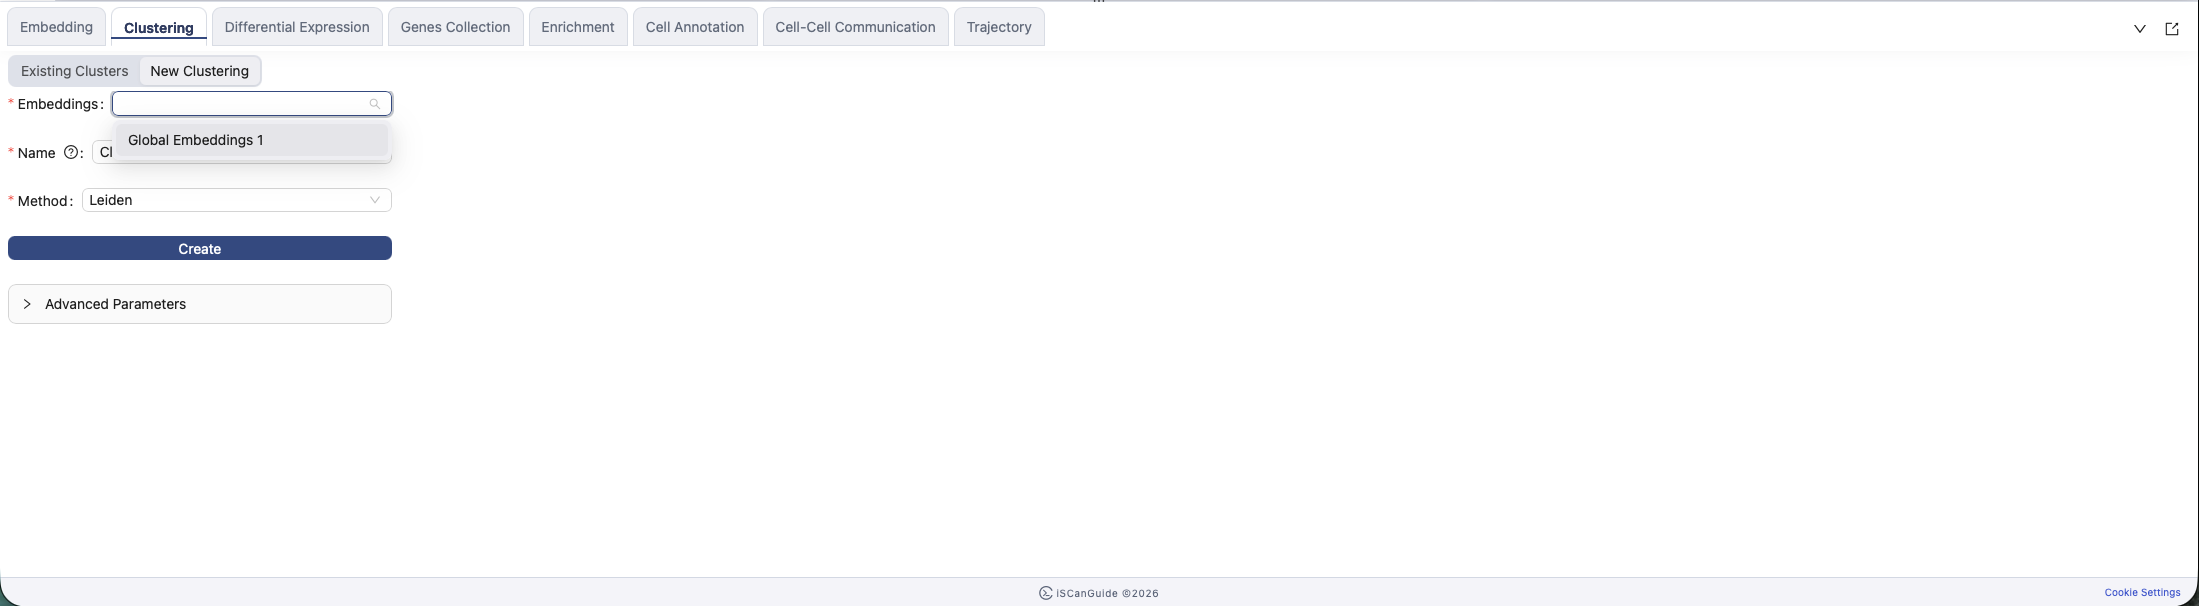
Name the clustering. {embedding} is replaced with the name of the embedding you selected.
4Choose a method
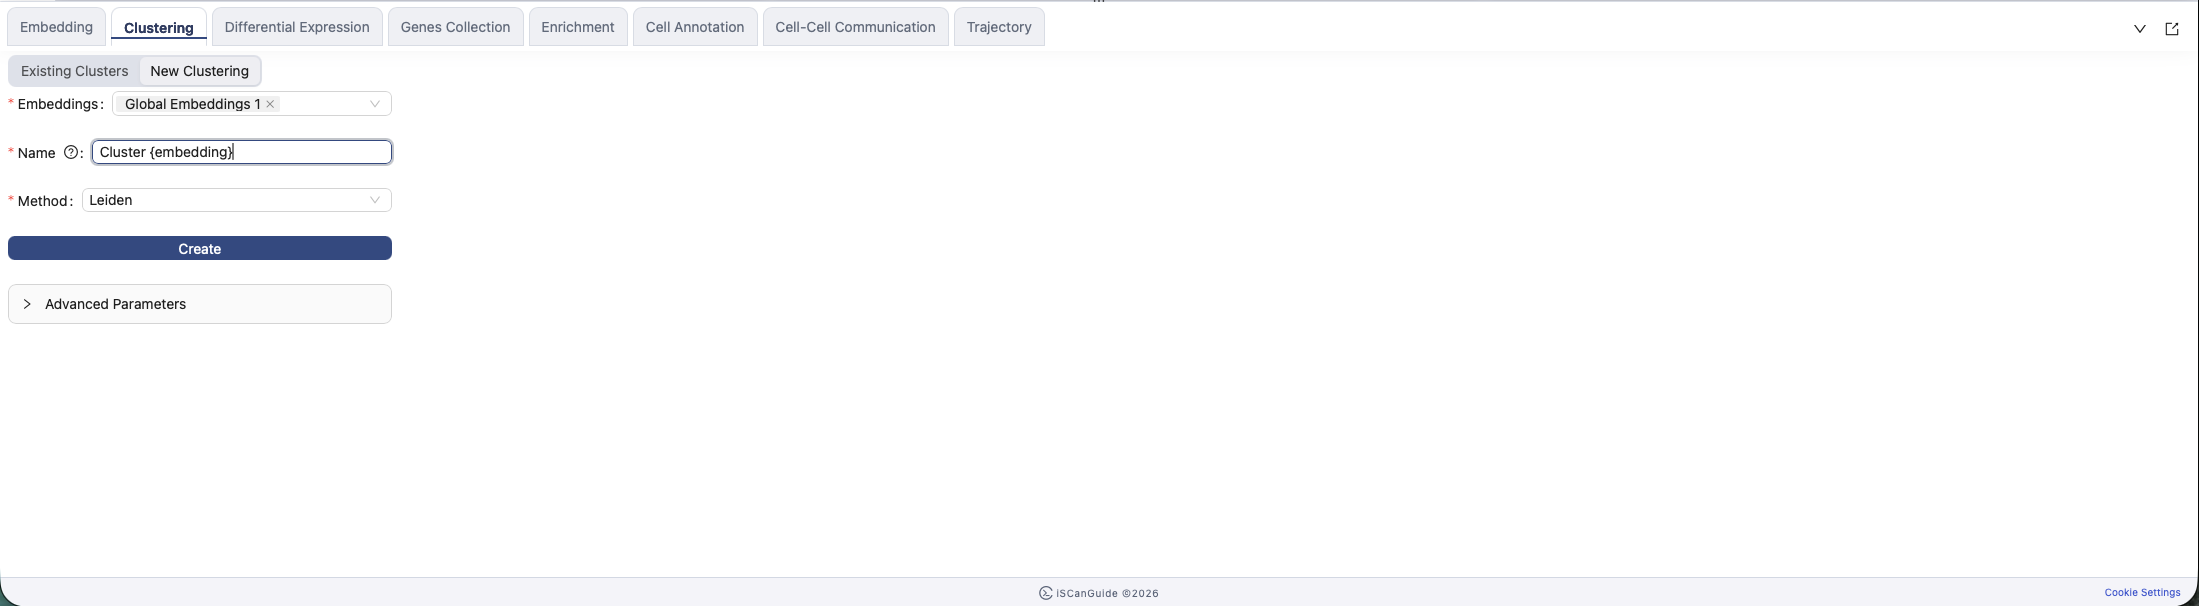
Louvain and Leiden find communities in a neighbour graph and decide the number of clusters themselves. KMeans divides cells into a number of clusters you specify.
5Advanced parameters
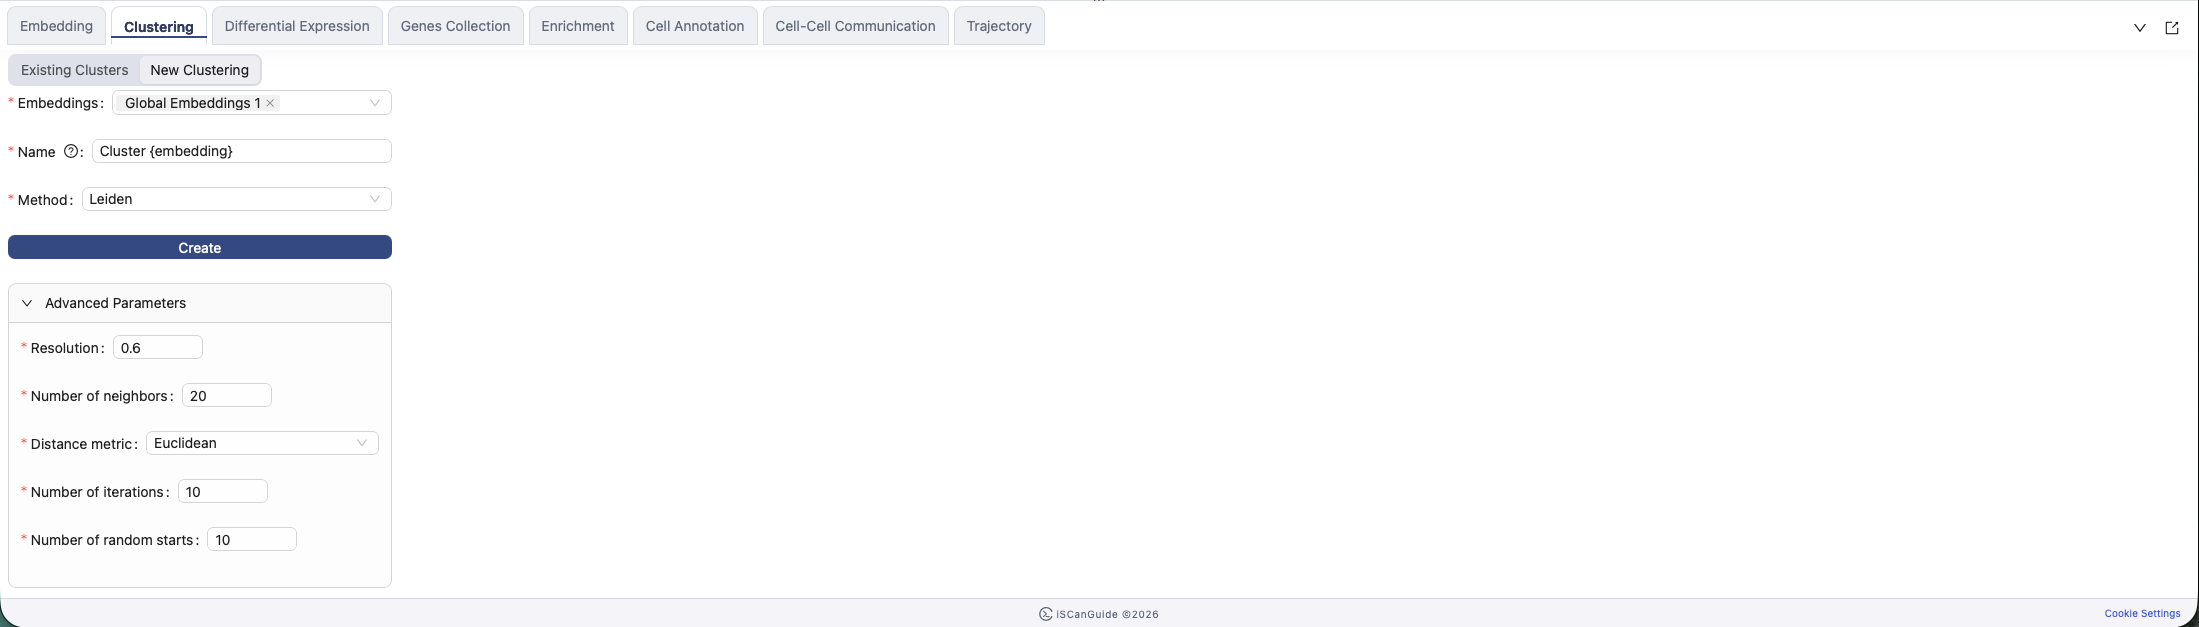
Resolution controls how finely the data is divided: higher values give more, smaller clusters. Number of neighbors sets how many neighbours each cell is compared against when the graph is built.
Parameters
Graph-based methods (Louvain, Leiden):
| Field | Range |
|---|---|
Resolution | 0.01 to 3, step 0.1 |
Number of neighbors | 5 to 100 |
Distance metric | Euclidean, Cosine |
Number of iterations | 1 to 100 |
KMeans:
| Field | Range |
|---|---|
Number of clusters | 2 to 30 |
Number of random starts | 1 to 20 |
If you selected several embeddings, KMeans asks for a cluster count for each one by name, so you can give a larger embedding more clusters than a smaller one.
6Existing clusterings
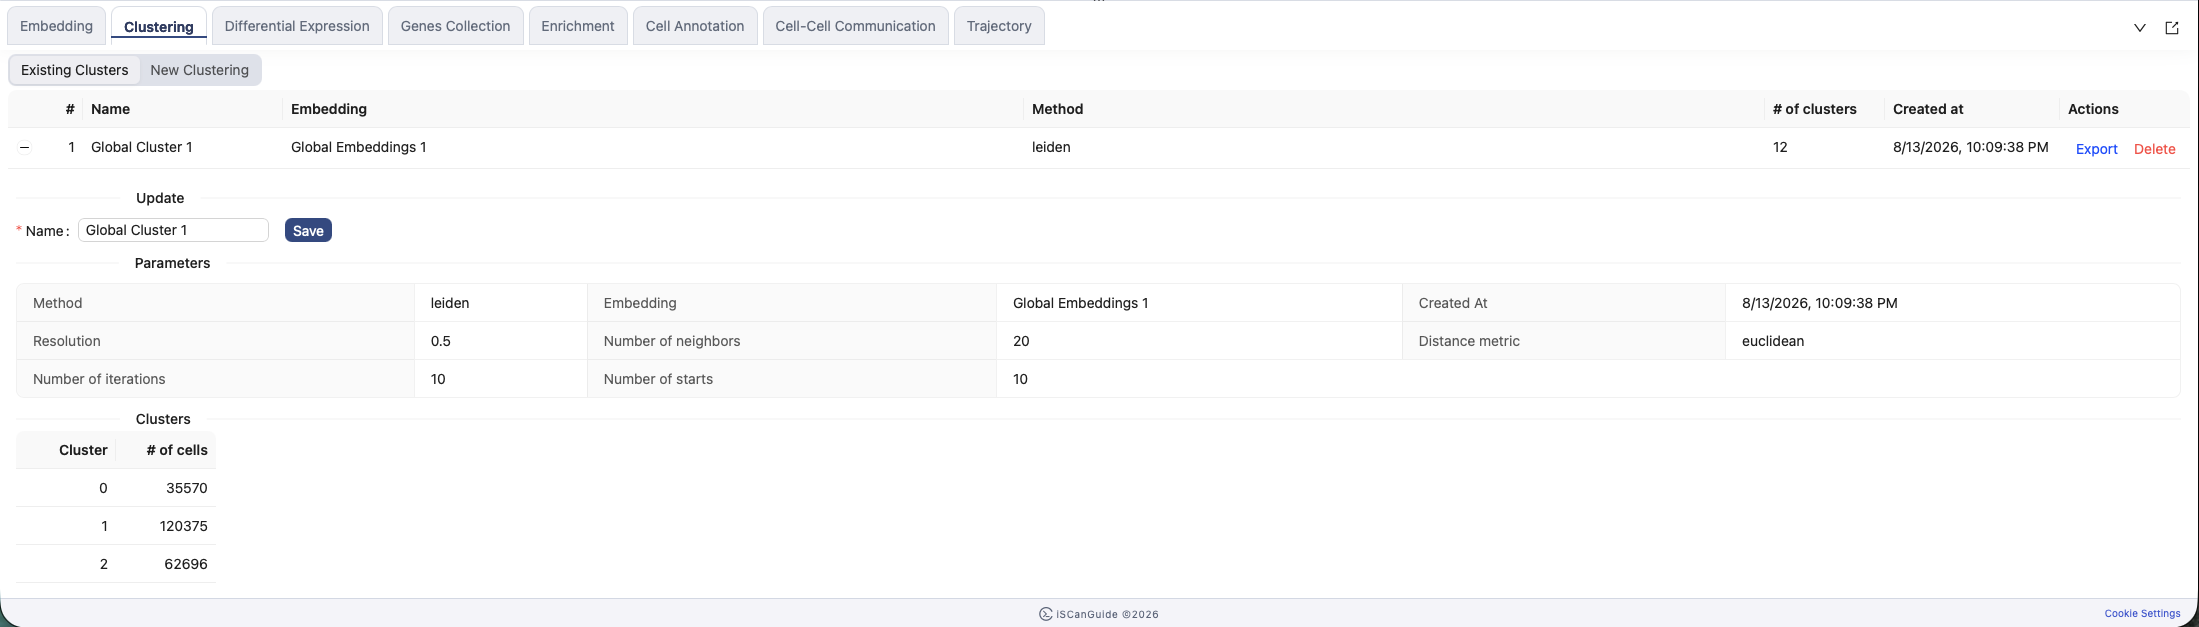
Click Create to run the clustering. Completed clusterings are listed with their method, embedding and cluster count. Expand one to see its parameters and the number of cells in each cluster.
7Visualize the clusters
Create a view and choose your clustering to colour cells by cluster. It also becomes available as a filter in the left rail and as a grouping in the other analysis modules.