Create Study and Upload Data
Shows how to create a study and bring data into it: naming the study, sharing it, choosing a data type and source, uploading files, reviewing samples, filtering on quality, and saving the result.
1Create a study
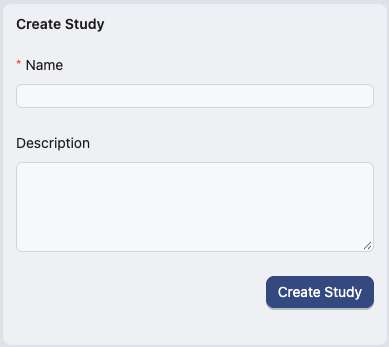
A study holds your samples, your filtering, and the results you build from them. Enter a name, add a description if you want one, then click Create Study. Both can be changed later.
2The data page
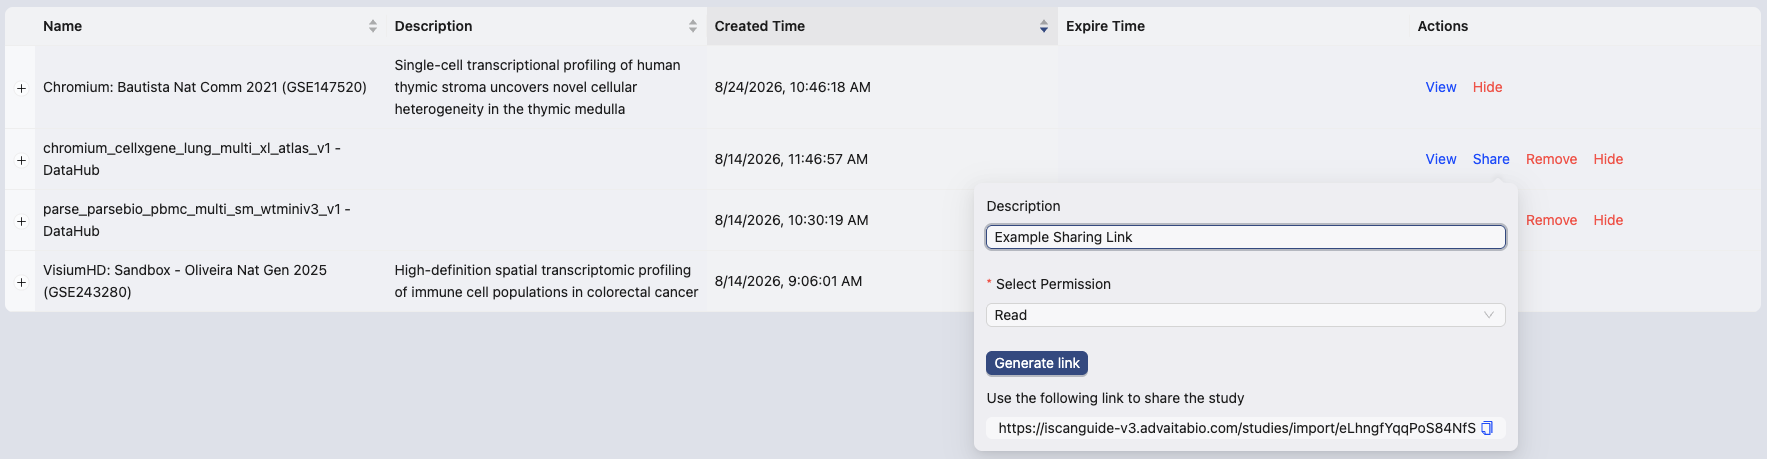
Your study opens on the data page. Samples are uploaded and filtered here before analysis. Working Samples holds samples you are still filtering. Saved Samples holds the ones you have committed.
3Share a study
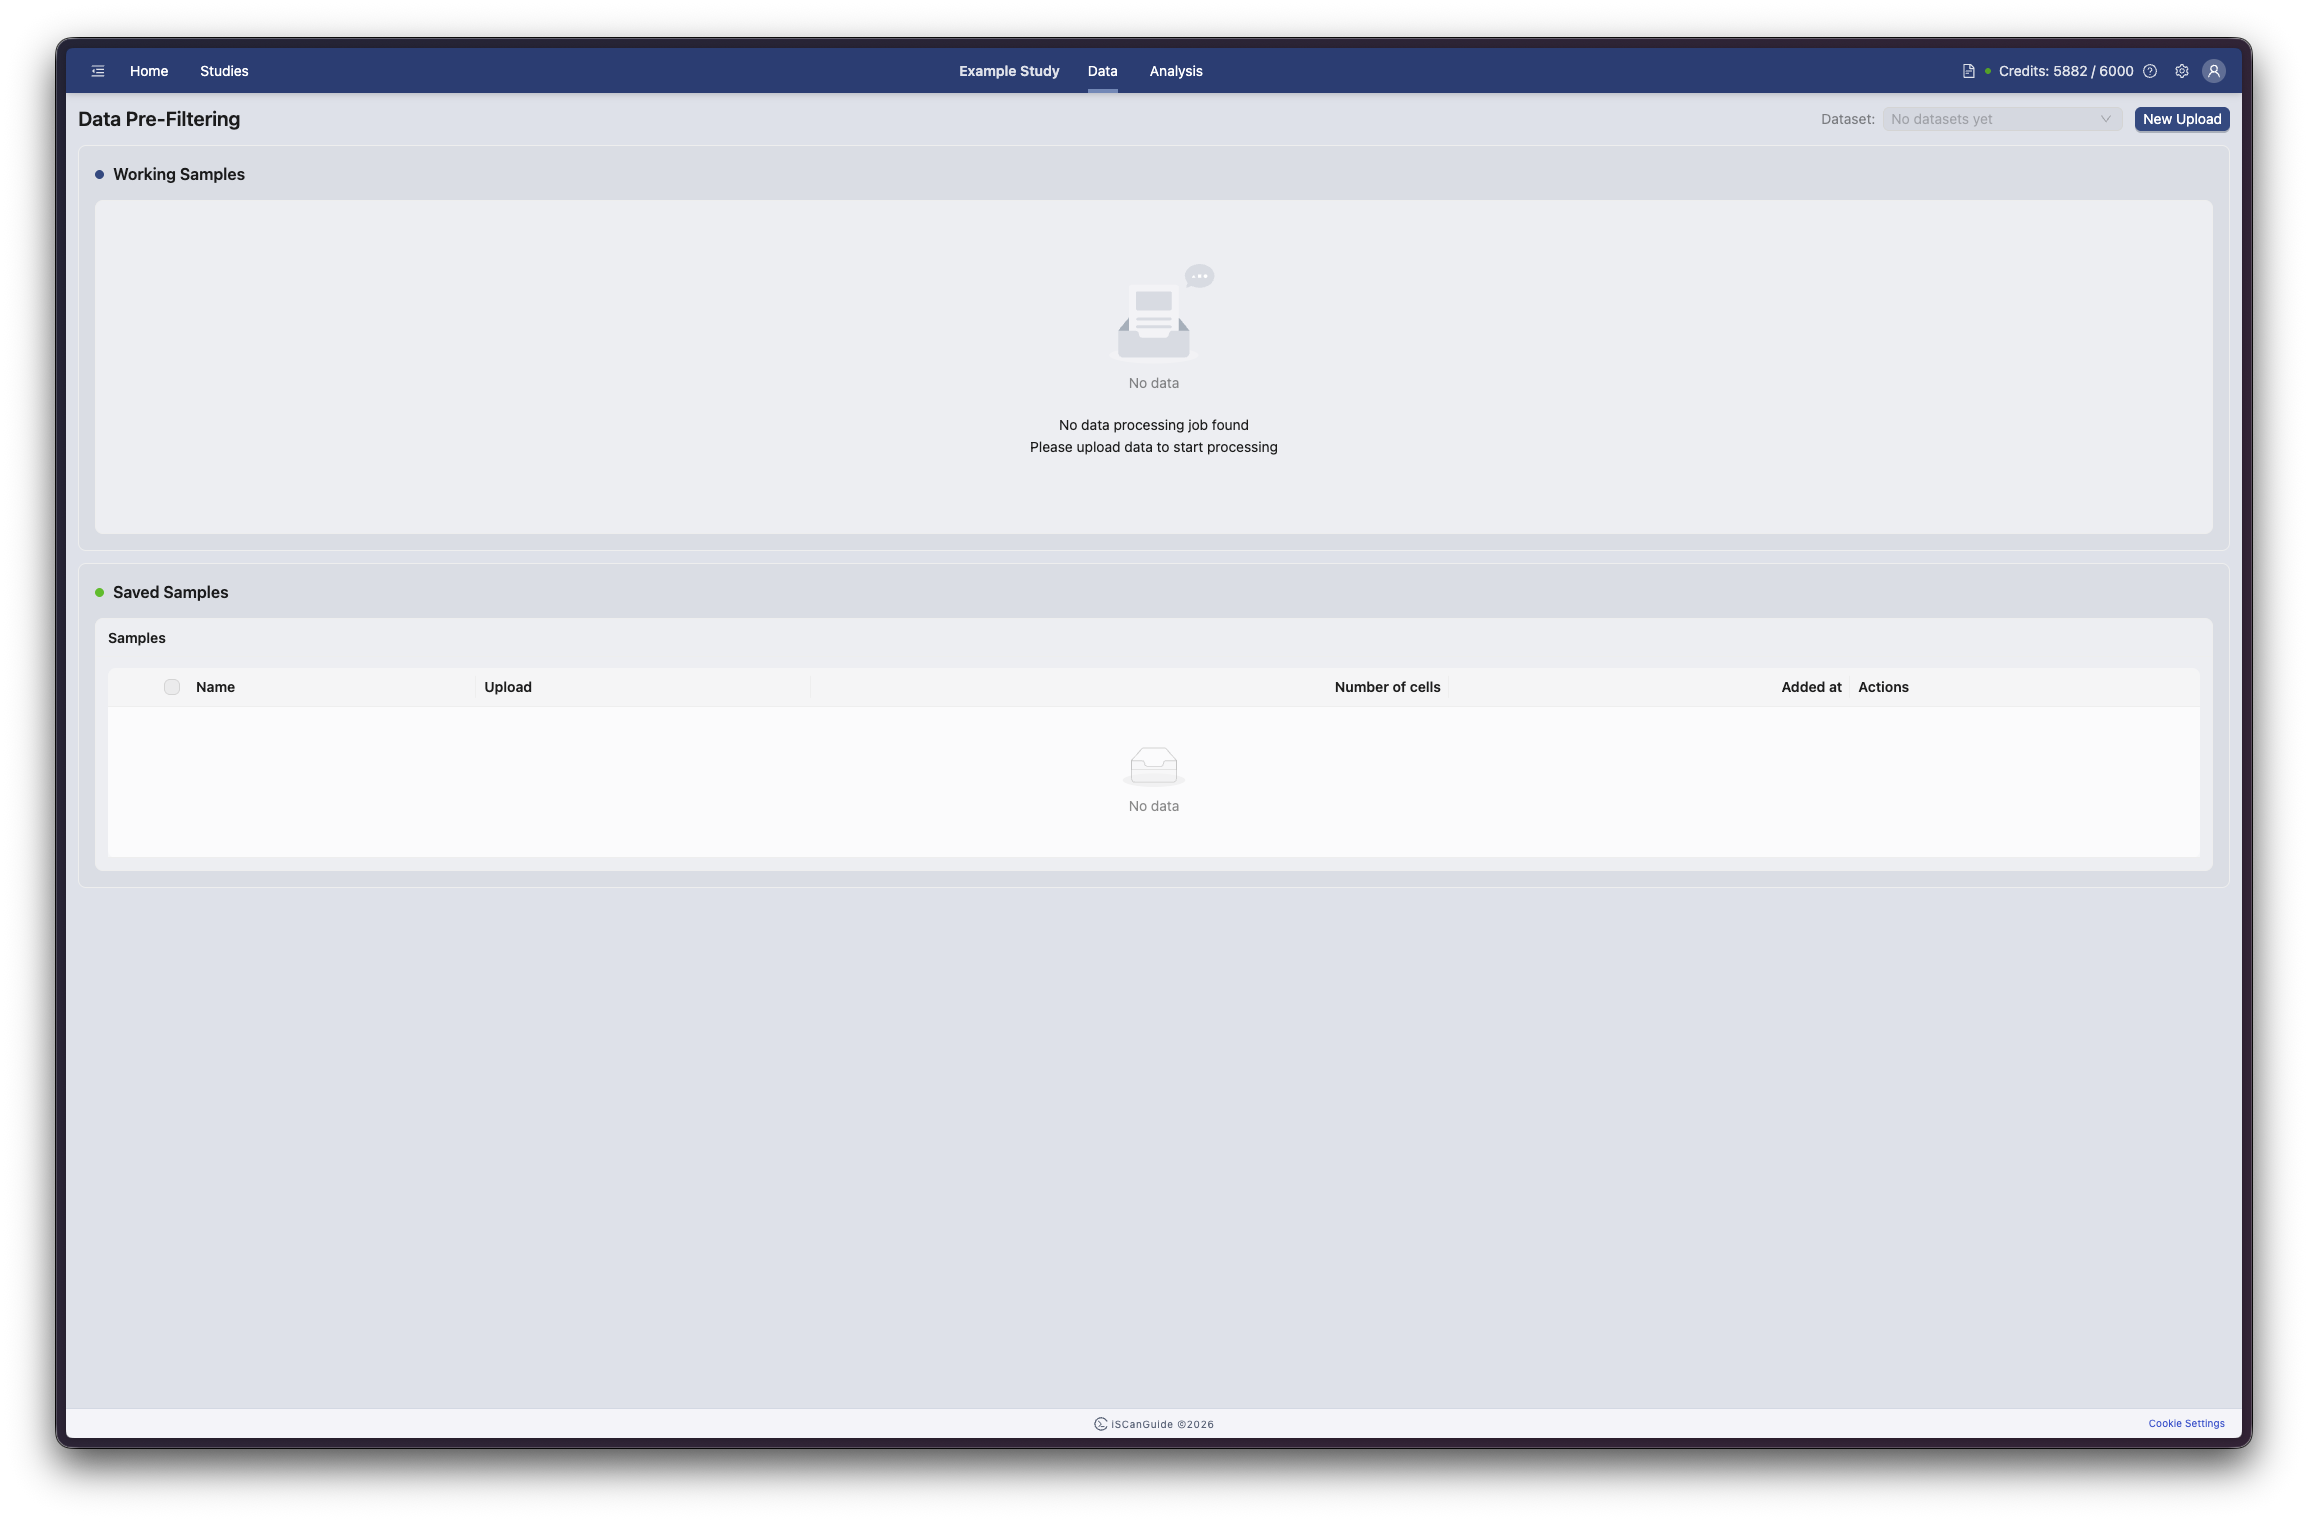
Generate a link from the studies list to share a study with a collaborator.
4Start an upload
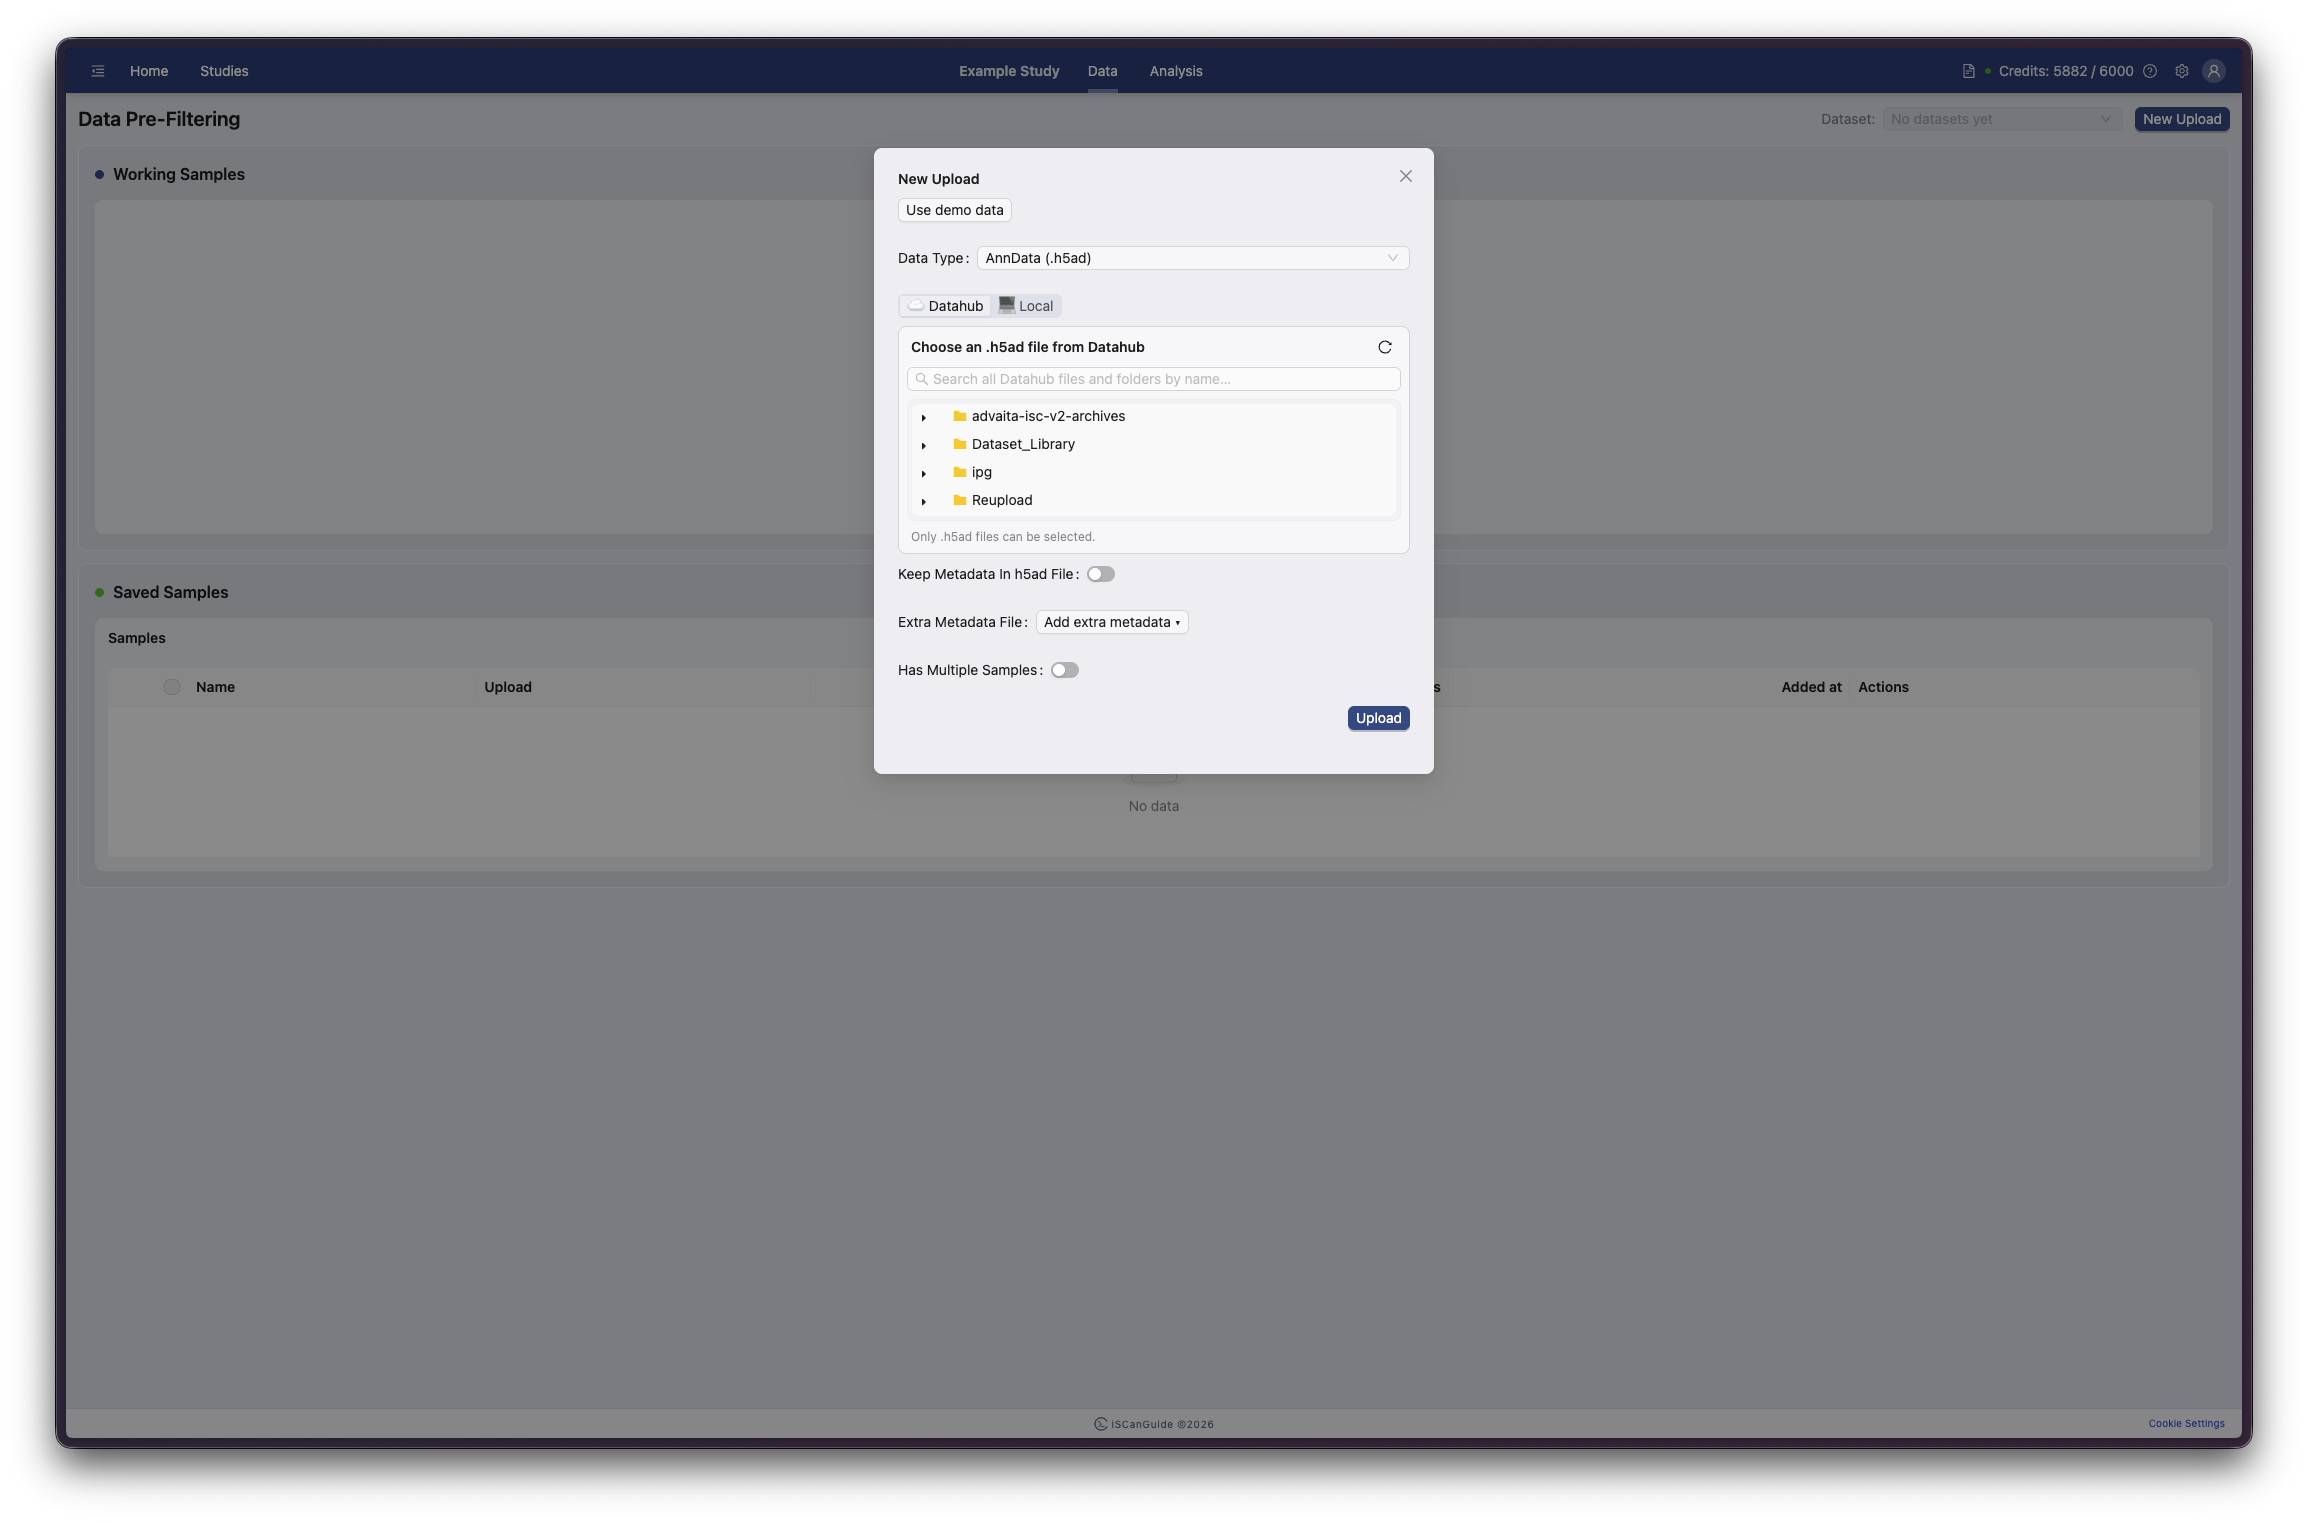
Click New Upload to open the upload form.
5Select your data type
Open Data Type and select the format your data is in. The list is grouped by vendor. iSCanGuide uses your choice to determine which files are required and which quality metrics apply.
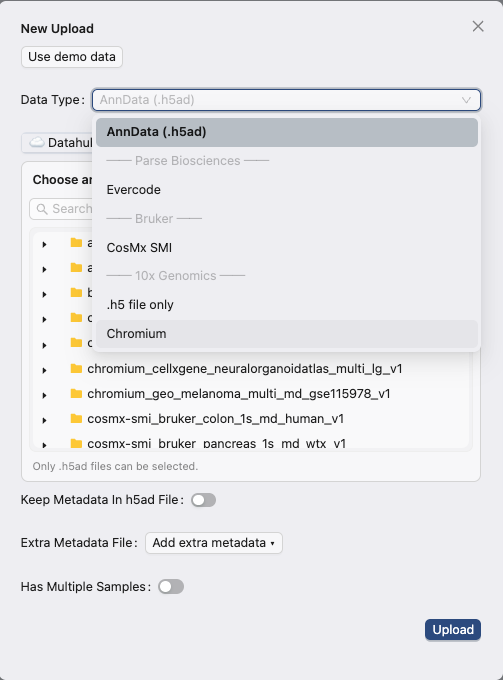
The Data Type list
Ten entries, under three vendor headings. AnnData (.h5ad) sits at the top, above the first heading.
| Order | Entry | Description |
|---|---|---|
| 1 | AnnData (.h5ad) | Pre-processed single-cell data in AnnData format |
| ── Parse Biosciences ── | ||
| 2 | Evercode | SPLiT-seq · split-pipe output |
| ── Bruker ── | ||
| 3 | CosMx SMI | Spatial molecular imaging · NanoString CosMx flat-file export |
| ── 10x Genomics ── | ||
| 4 | .h5 file only | Single-cell RNA-seq · Cell Ranger H5 output |
| 5 | Chromium | Single-cell RNA-seq · Cell Ranger output |
| 6 | Visium V1 | Spatial transcriptomics · Space Ranger output |
| 7 | Visium V2 (CytAssist) | Spatial transcriptomics · Space Ranger output |
| 8 | Visium HD (Cell Segmentation) | High-definition spatial · Space Ranger 3+ cell segmentation output |
| 9 | Visium HD (Binned) | High-definition spatial · Space Ranger 3+ binned output |
| 10 | Xenium / Atera | Spatial transcriptomics · 10x Xenium or Atera output |
6Select a data source
Files can come from two places: ☁️ DataHub, the shared catalog, or 💻 Local, your own computer. You can switch between them at any point.
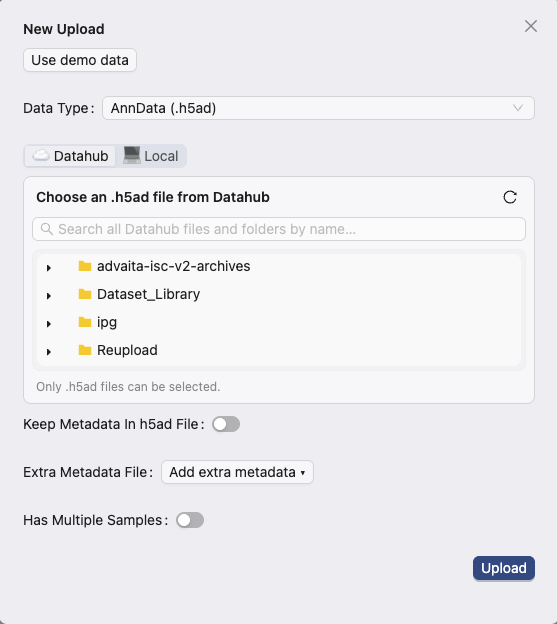
7Upload files from your computer
Drop a folder or a compressed archive onto the upload area, or click to browse. iSCanGuide scans the folder and identifies the files it contains.
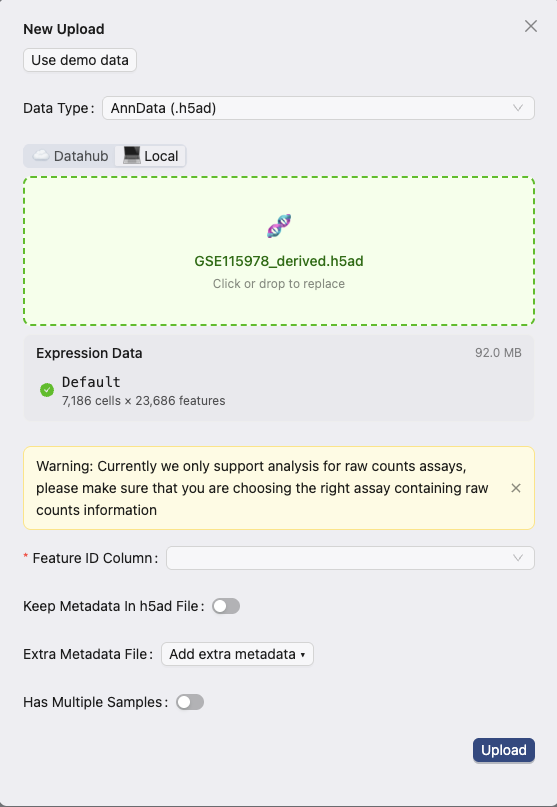
8Select files from DataHub
DataHub is a storage solution, and it shows you the data that has been uploaded and is available to your account. Search by file name or browse the folder tree, then select the files or folder you want to upload.
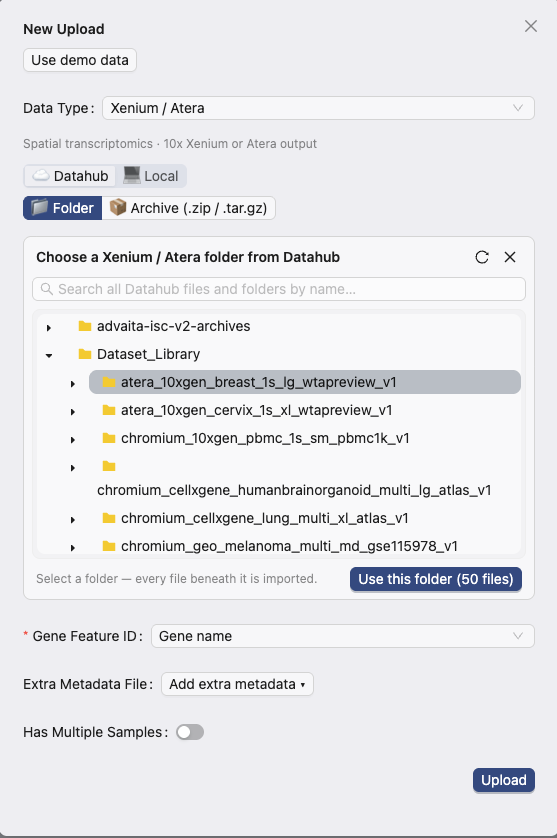
9Required and optional files
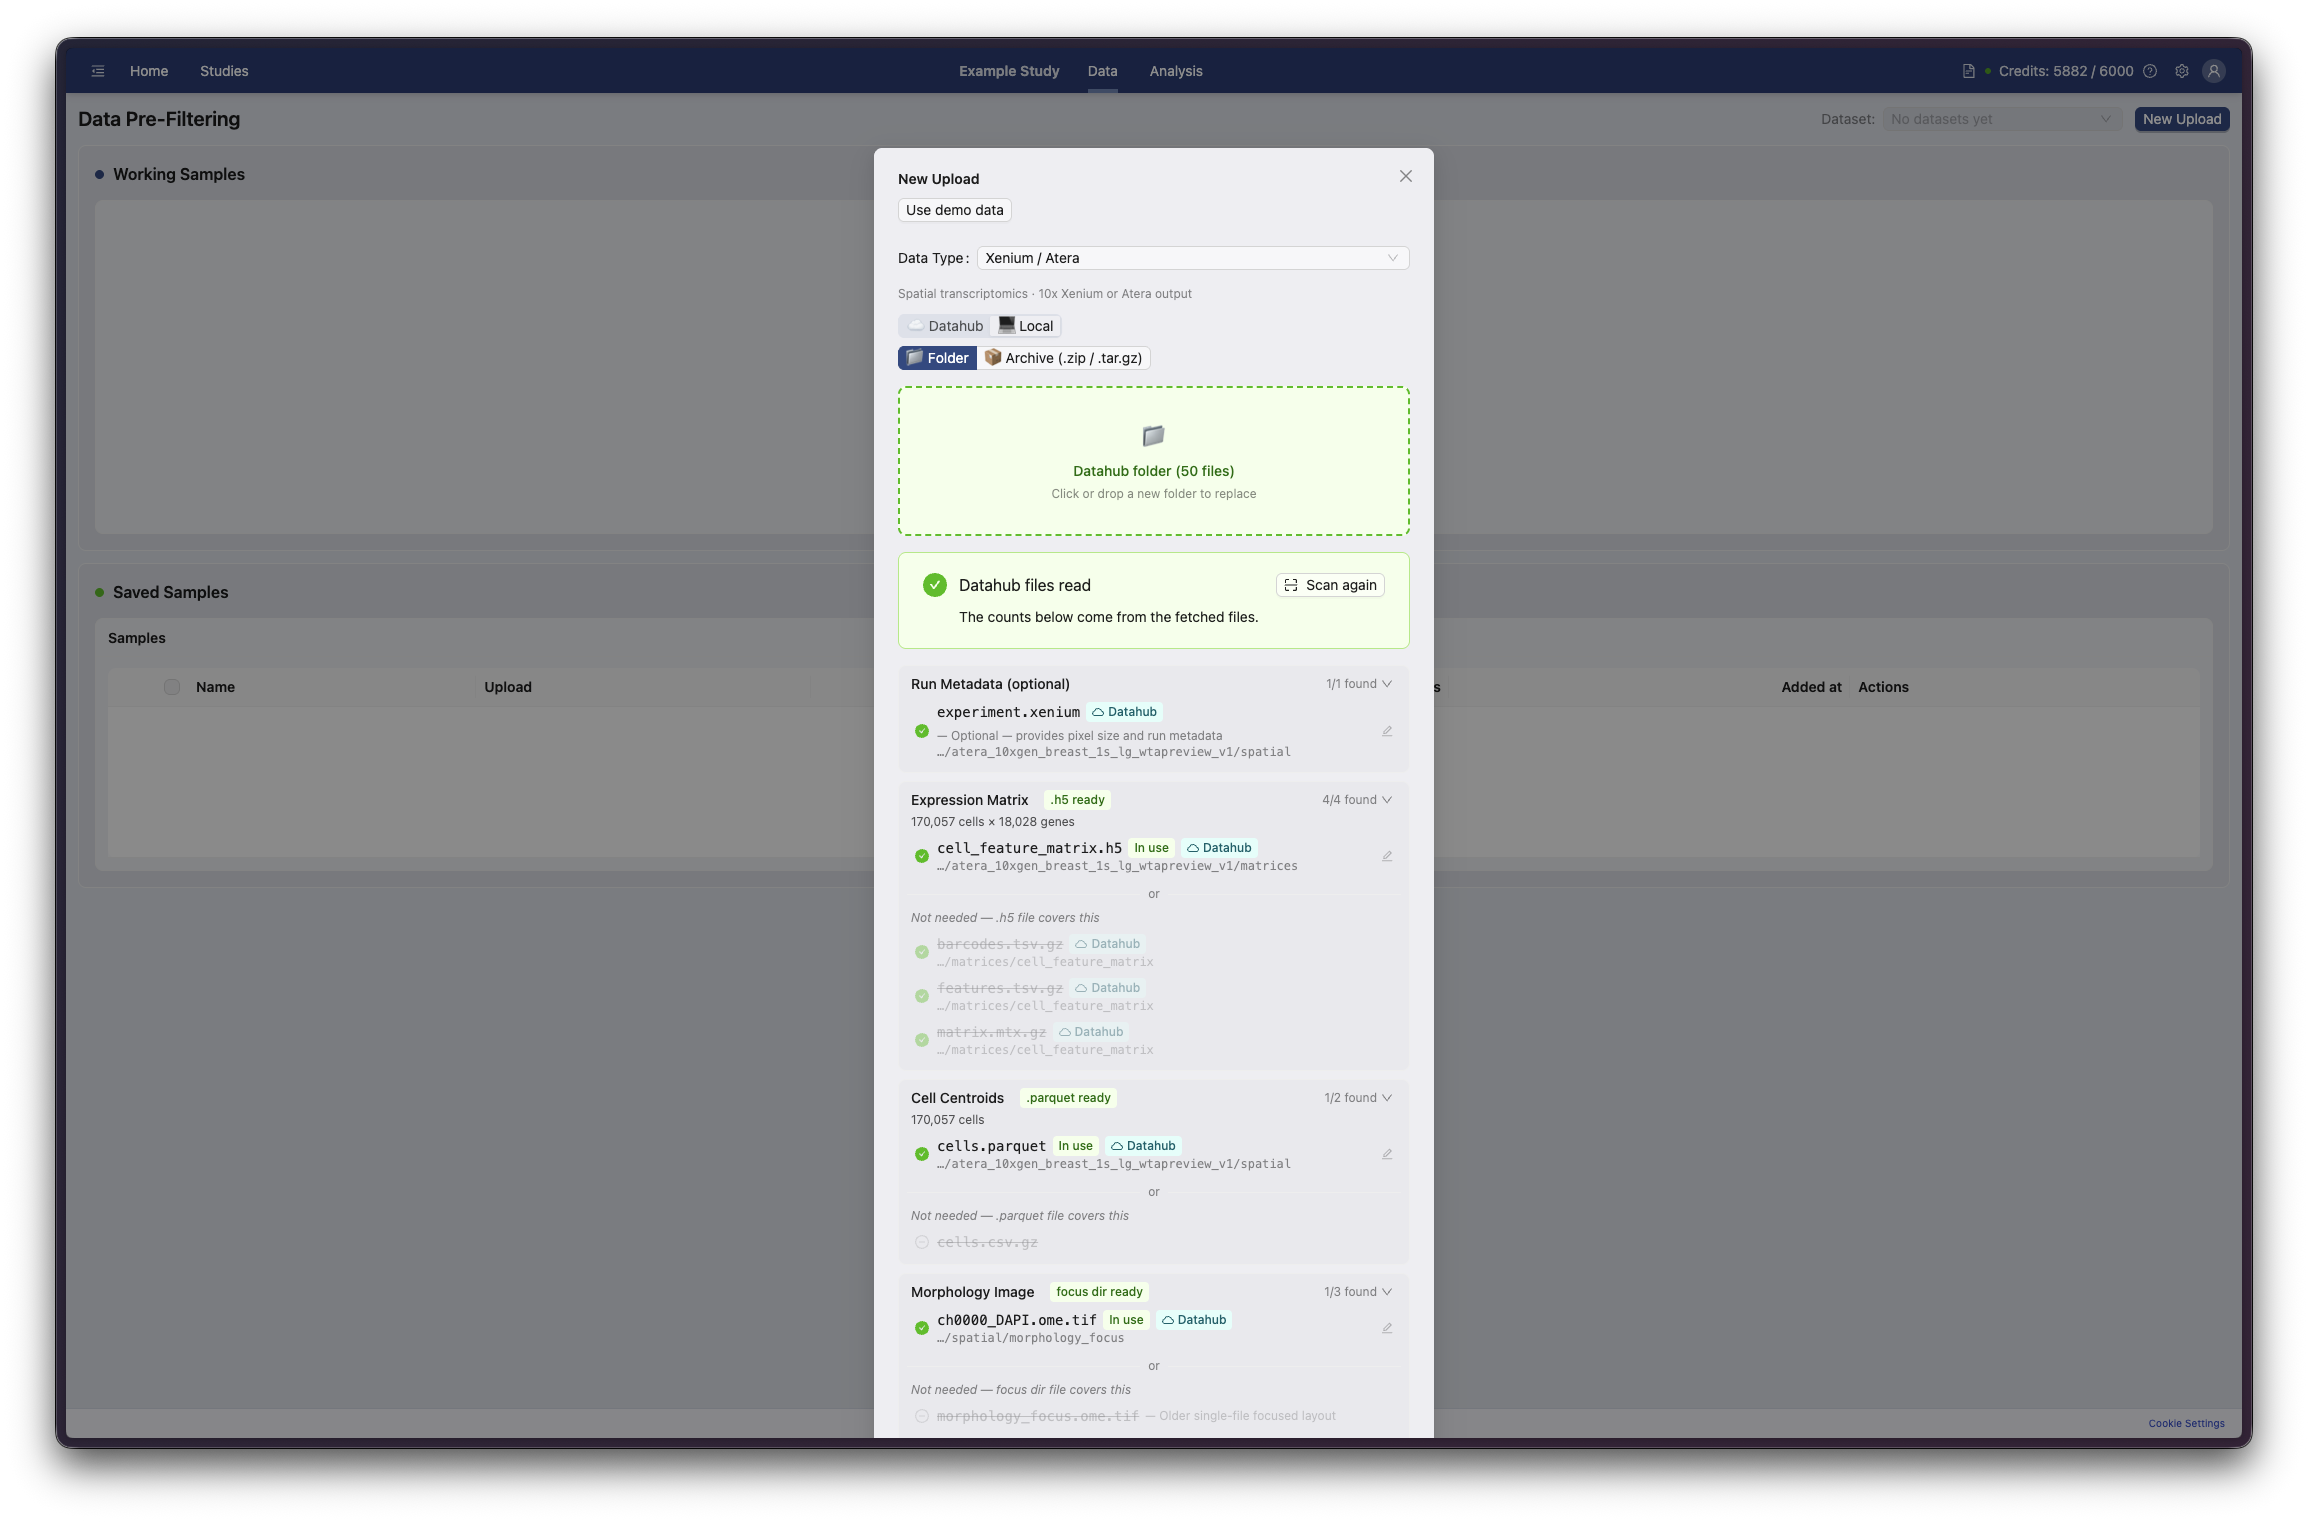
iSCanGuide lists the files expected for your data type and marks the ones it found. Required files must be present before you can continue. Optional files, such as tissue images, are used when they are available.
10Uploading multiple samples
A single upload can contain several samples. Review the list before continuing. Each row shows the sample name and the cells and genes found in it.
11AnnData options
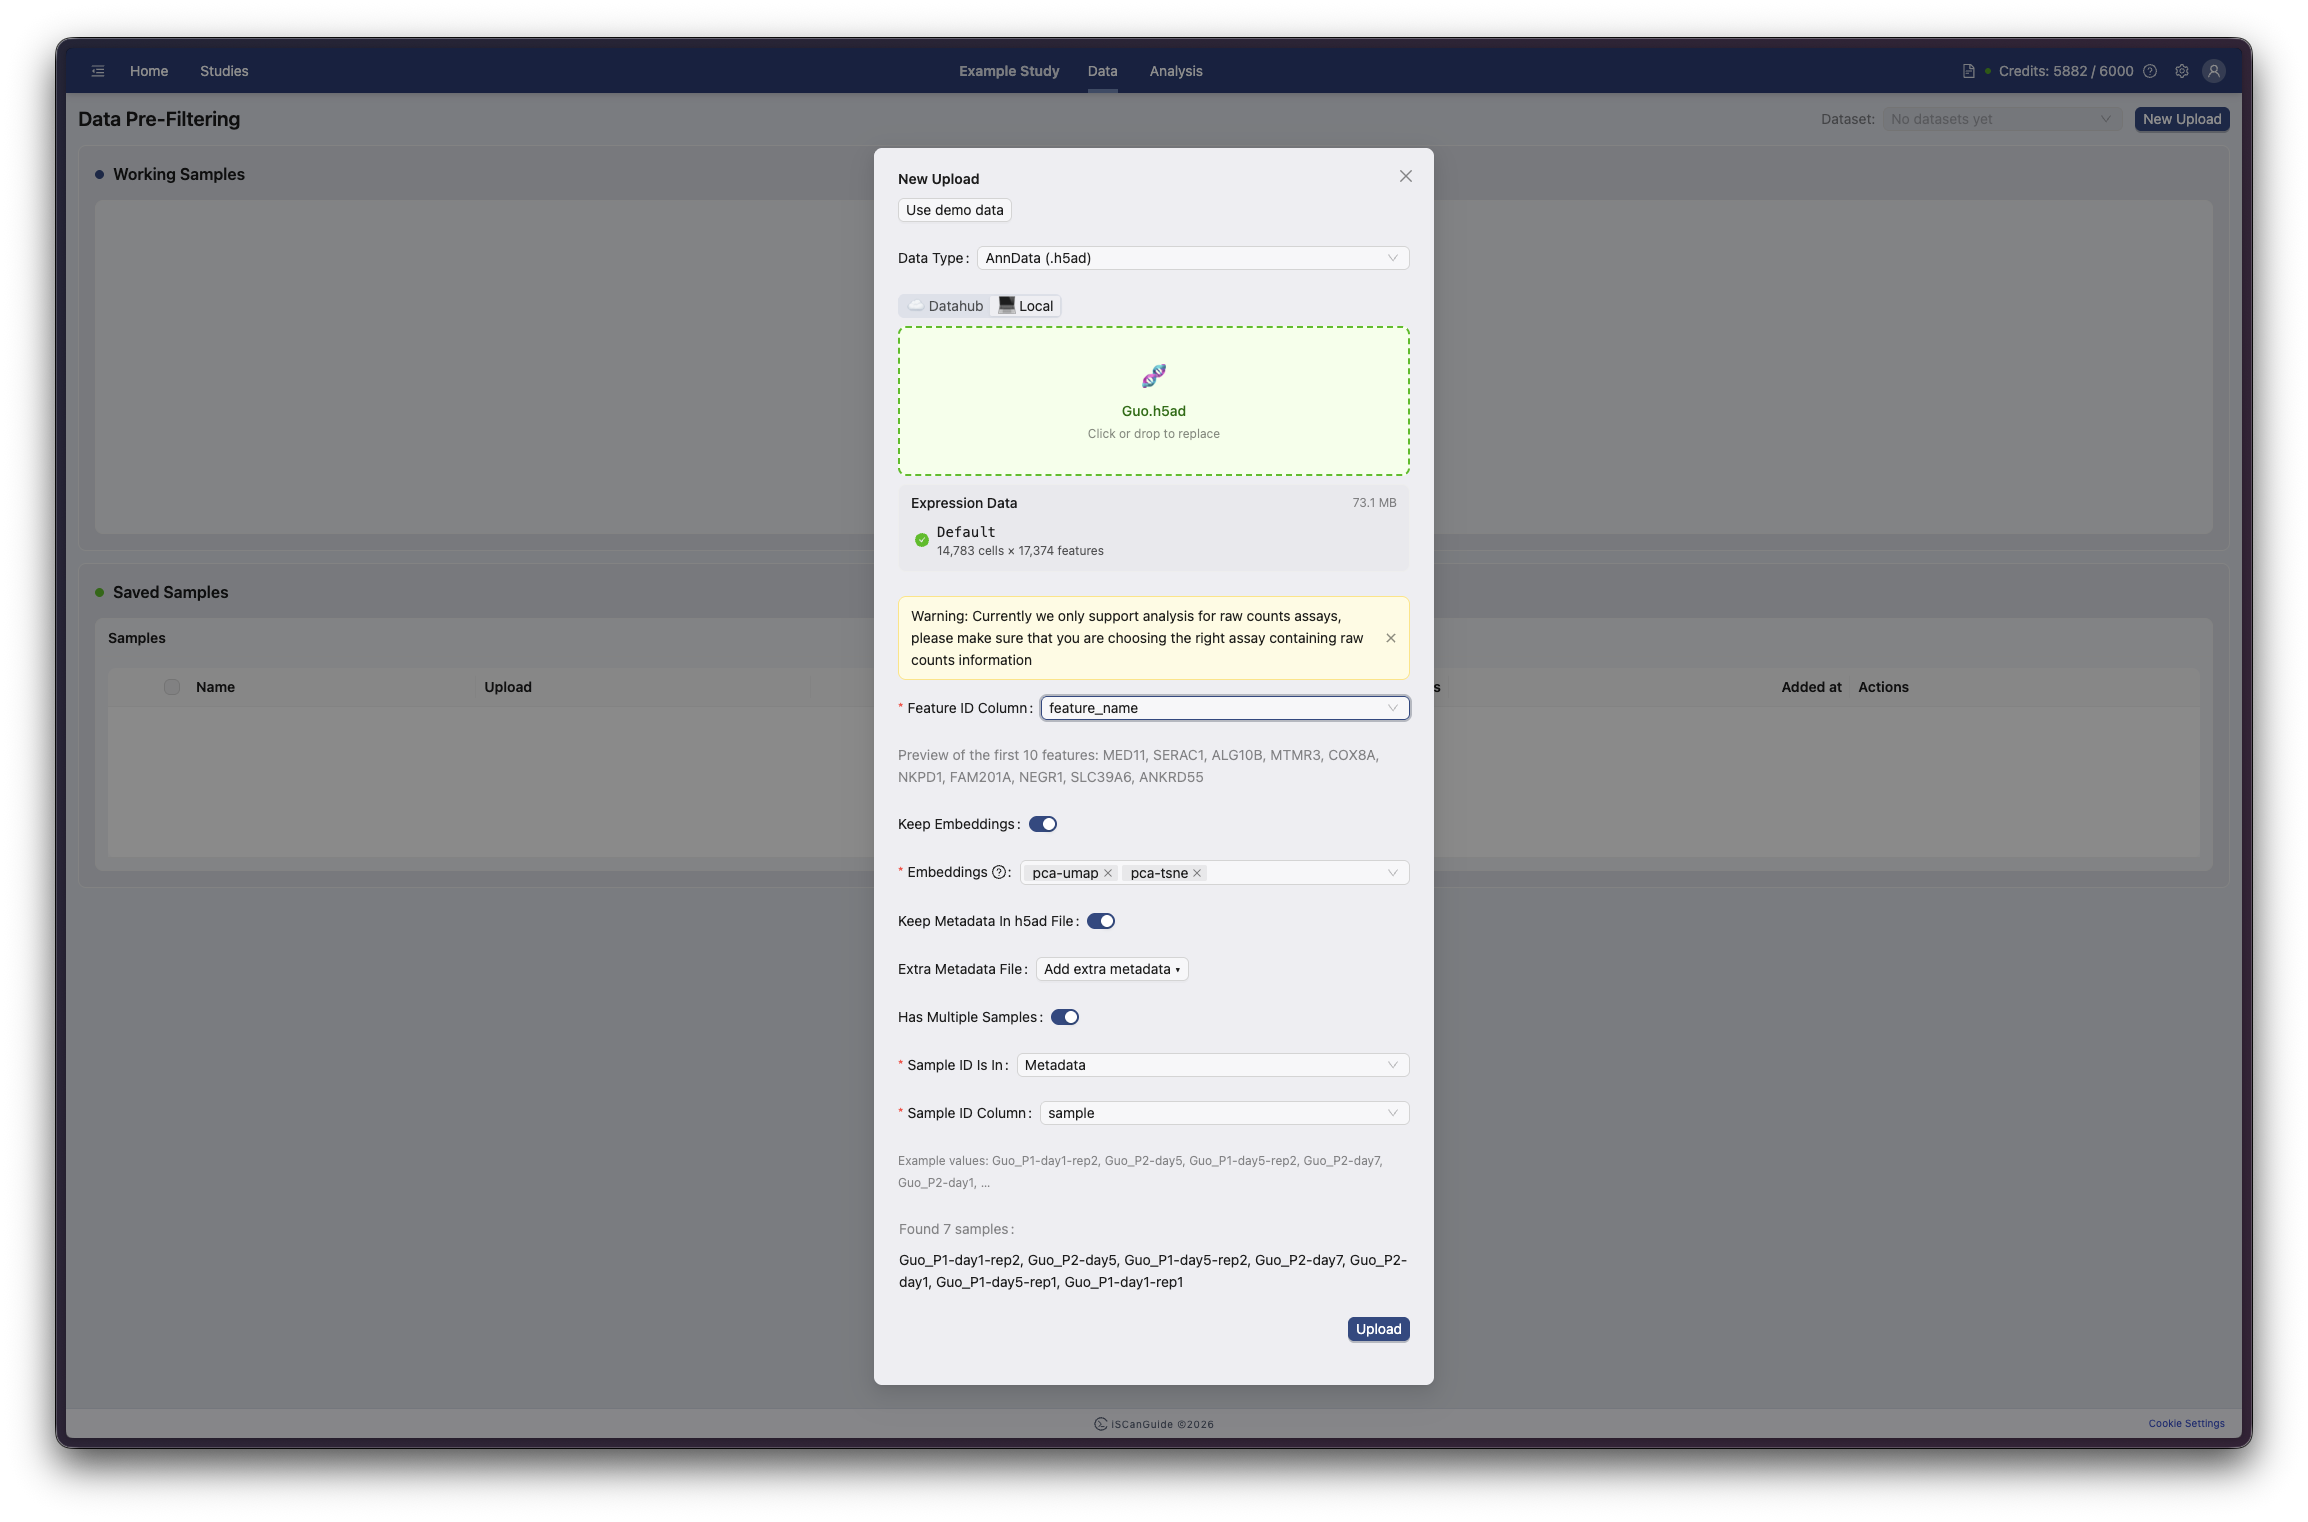
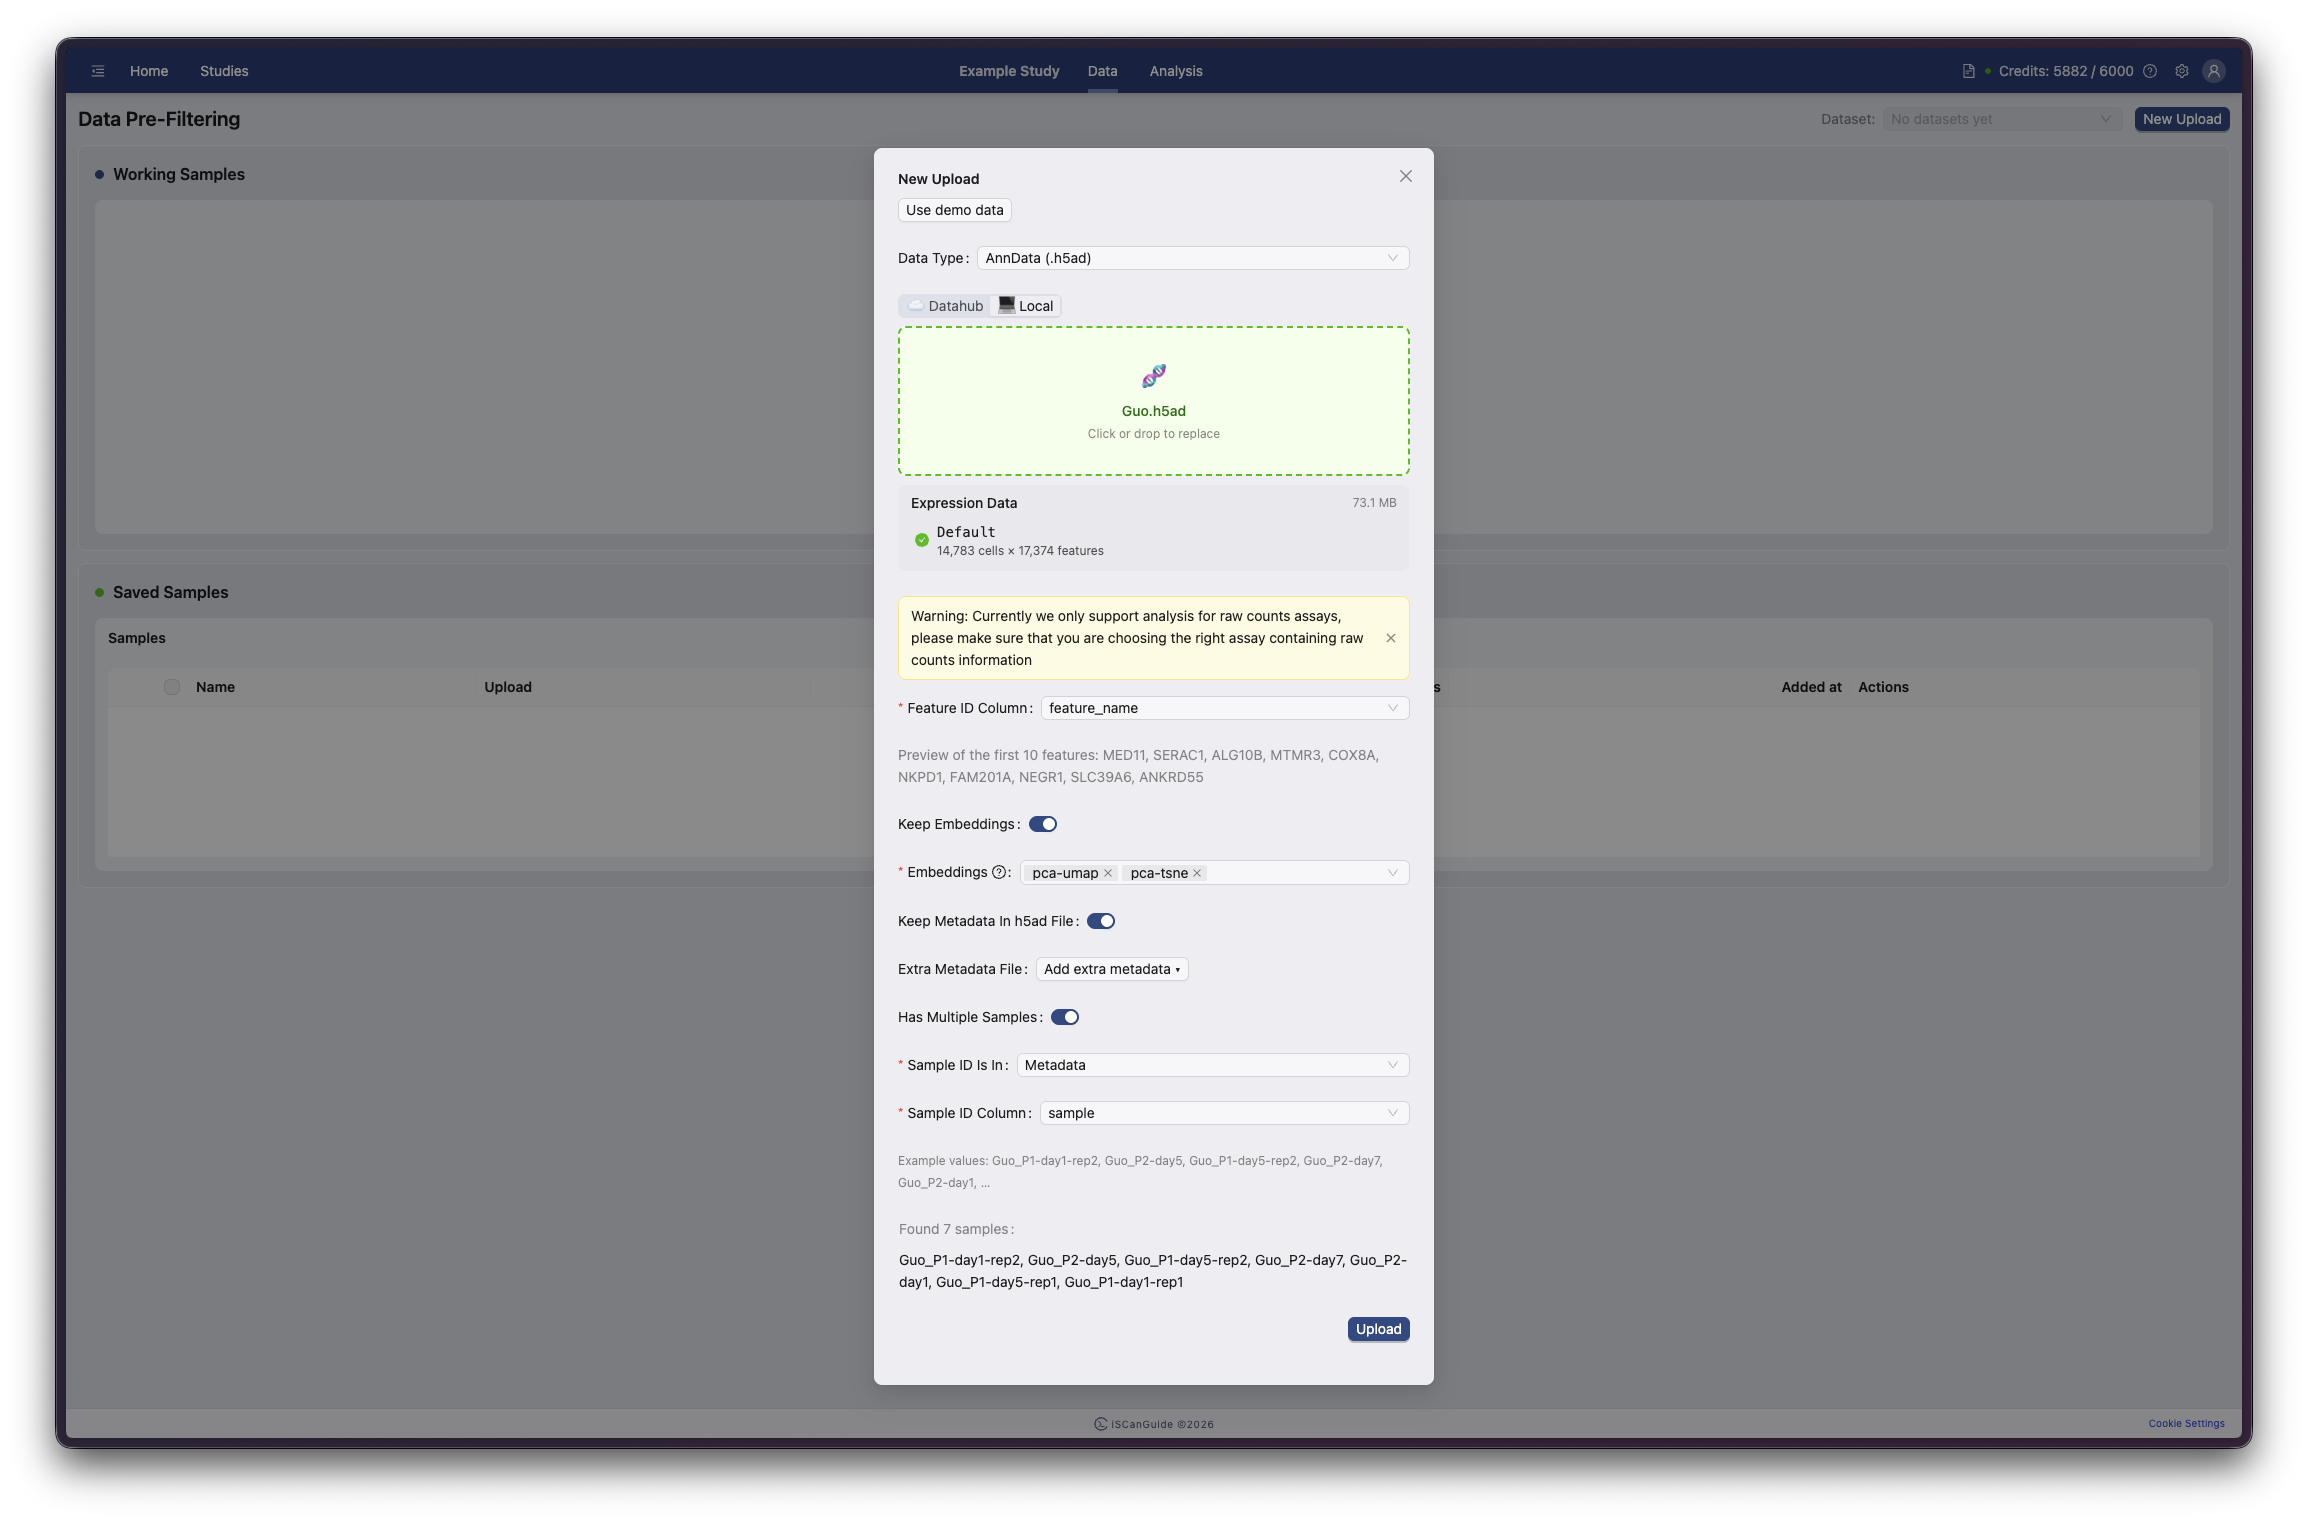
AnnData files carry their own structure, so iSCanGuide asks how to read yours. Tell it which column holds the cell IDs, which gene identifier to use, and whether to keep the embeddings already in the file.
12Working samples
Uploaded samples appear under Working Samples. They are not committed yet. Filter them here and adjust as often as you need before saving.
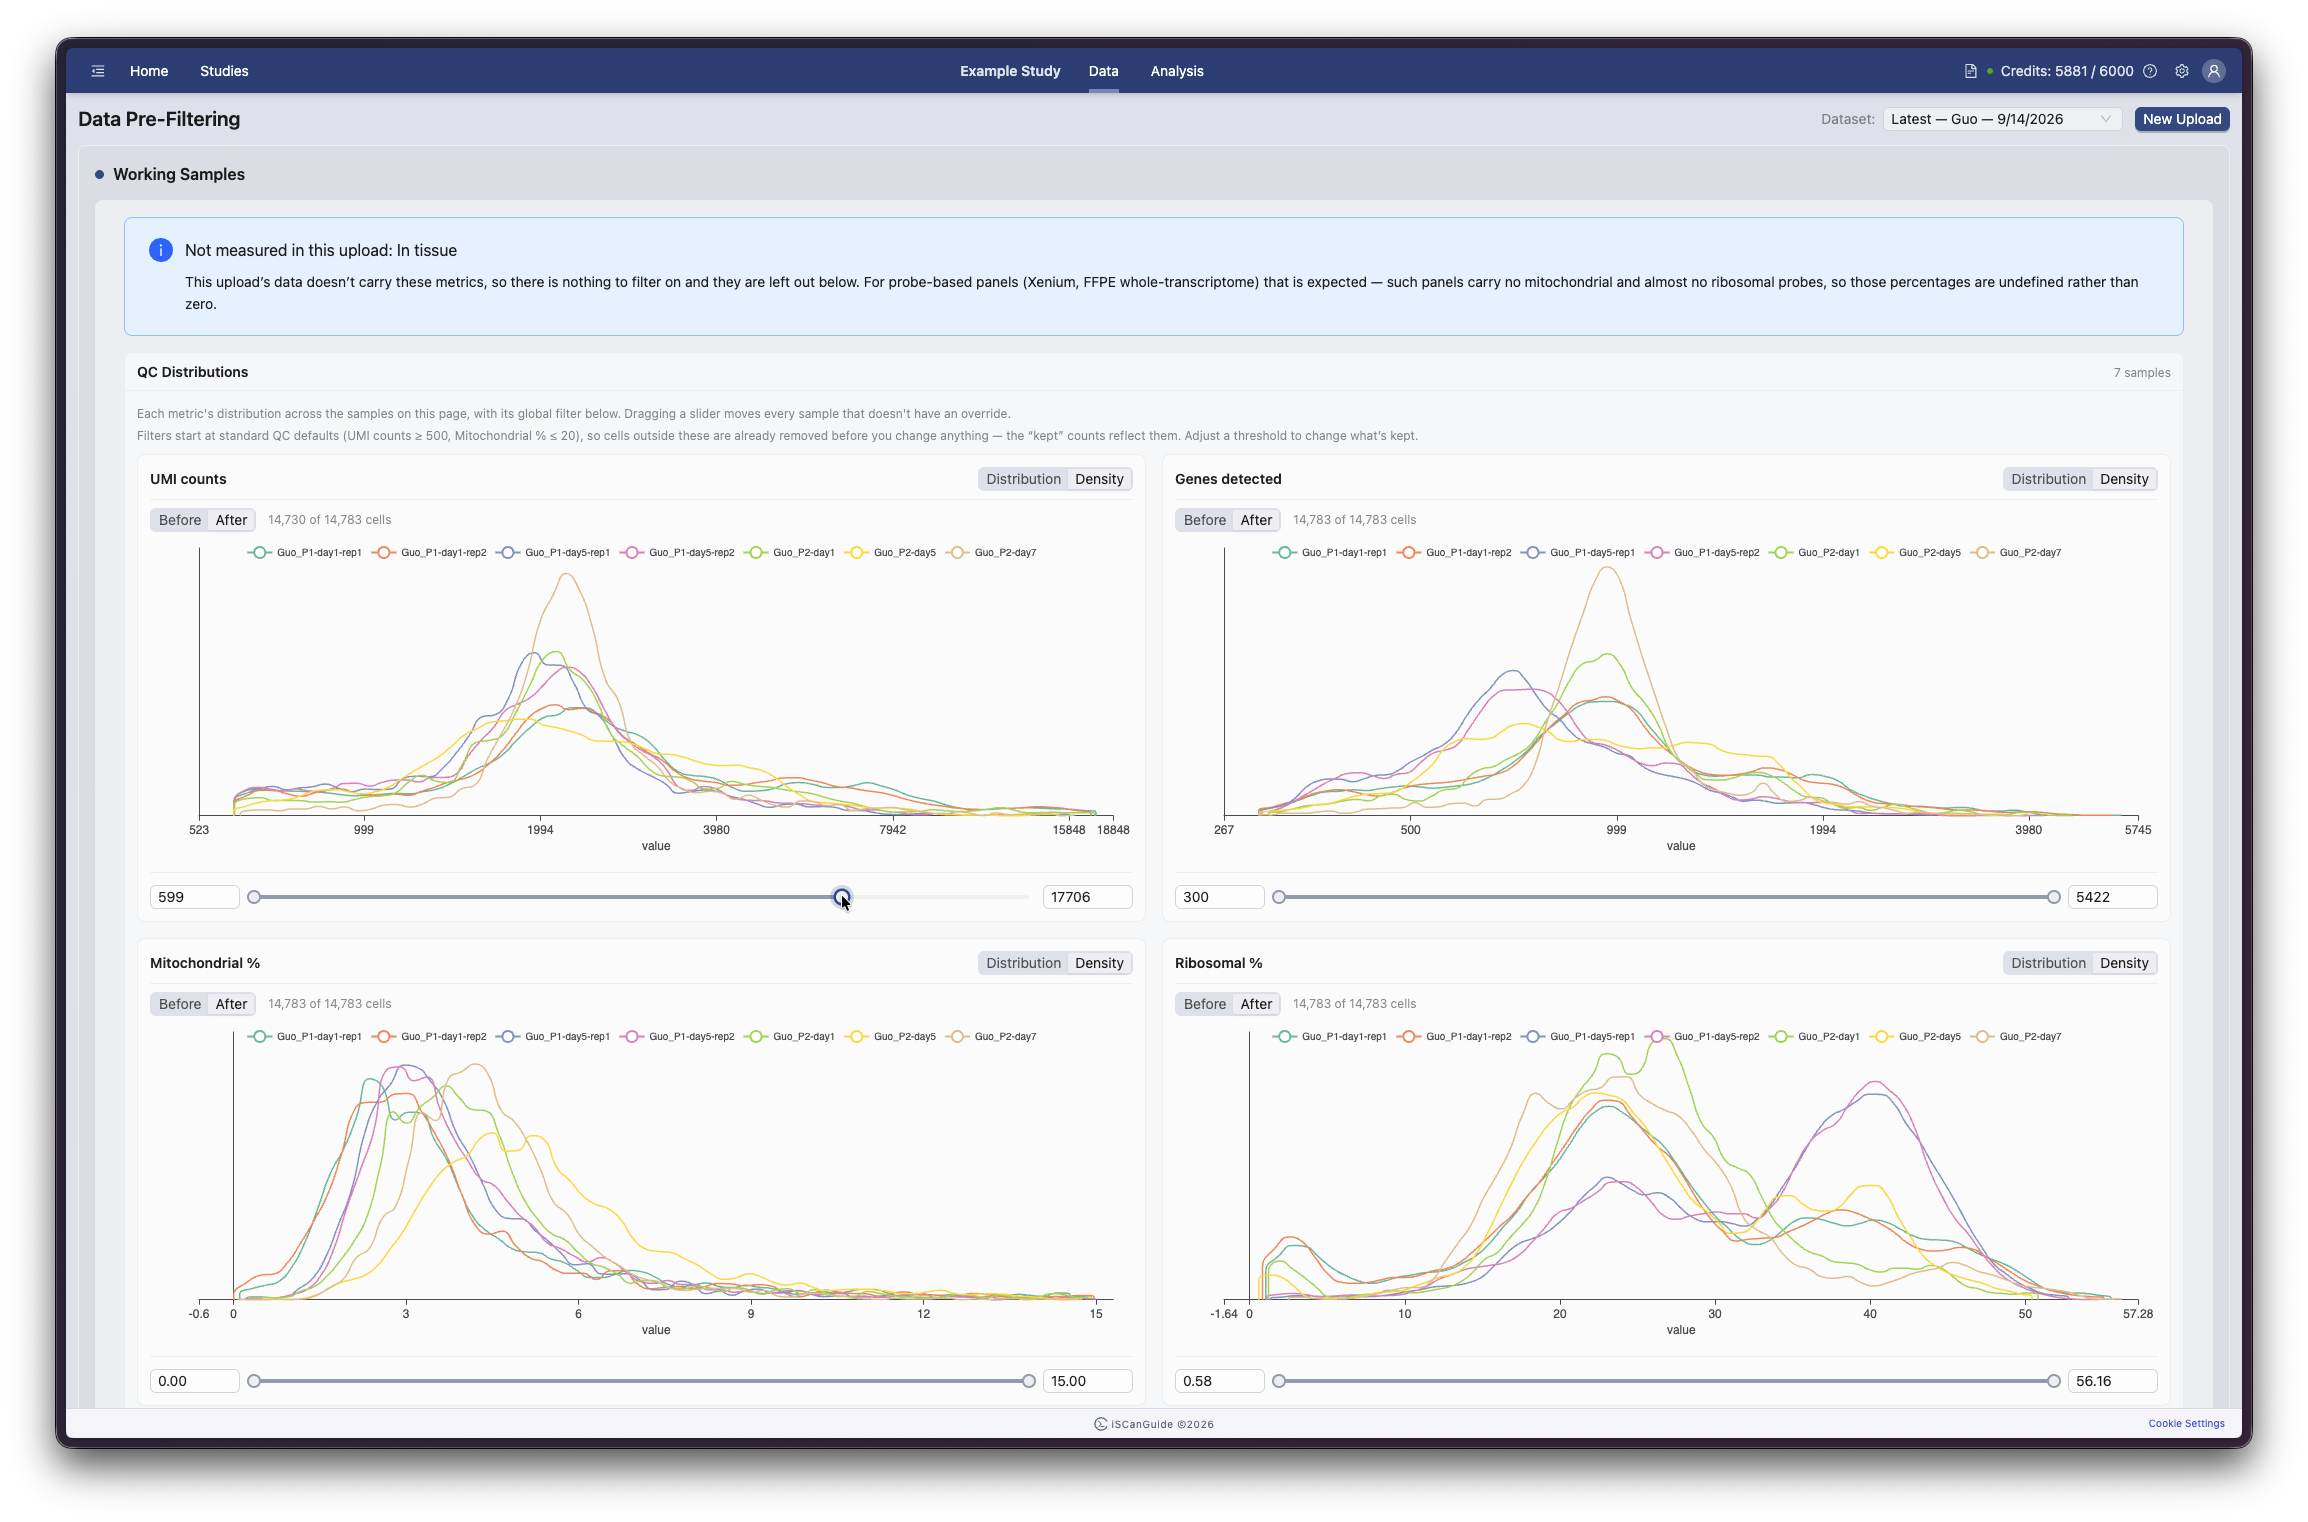
13QC distributions
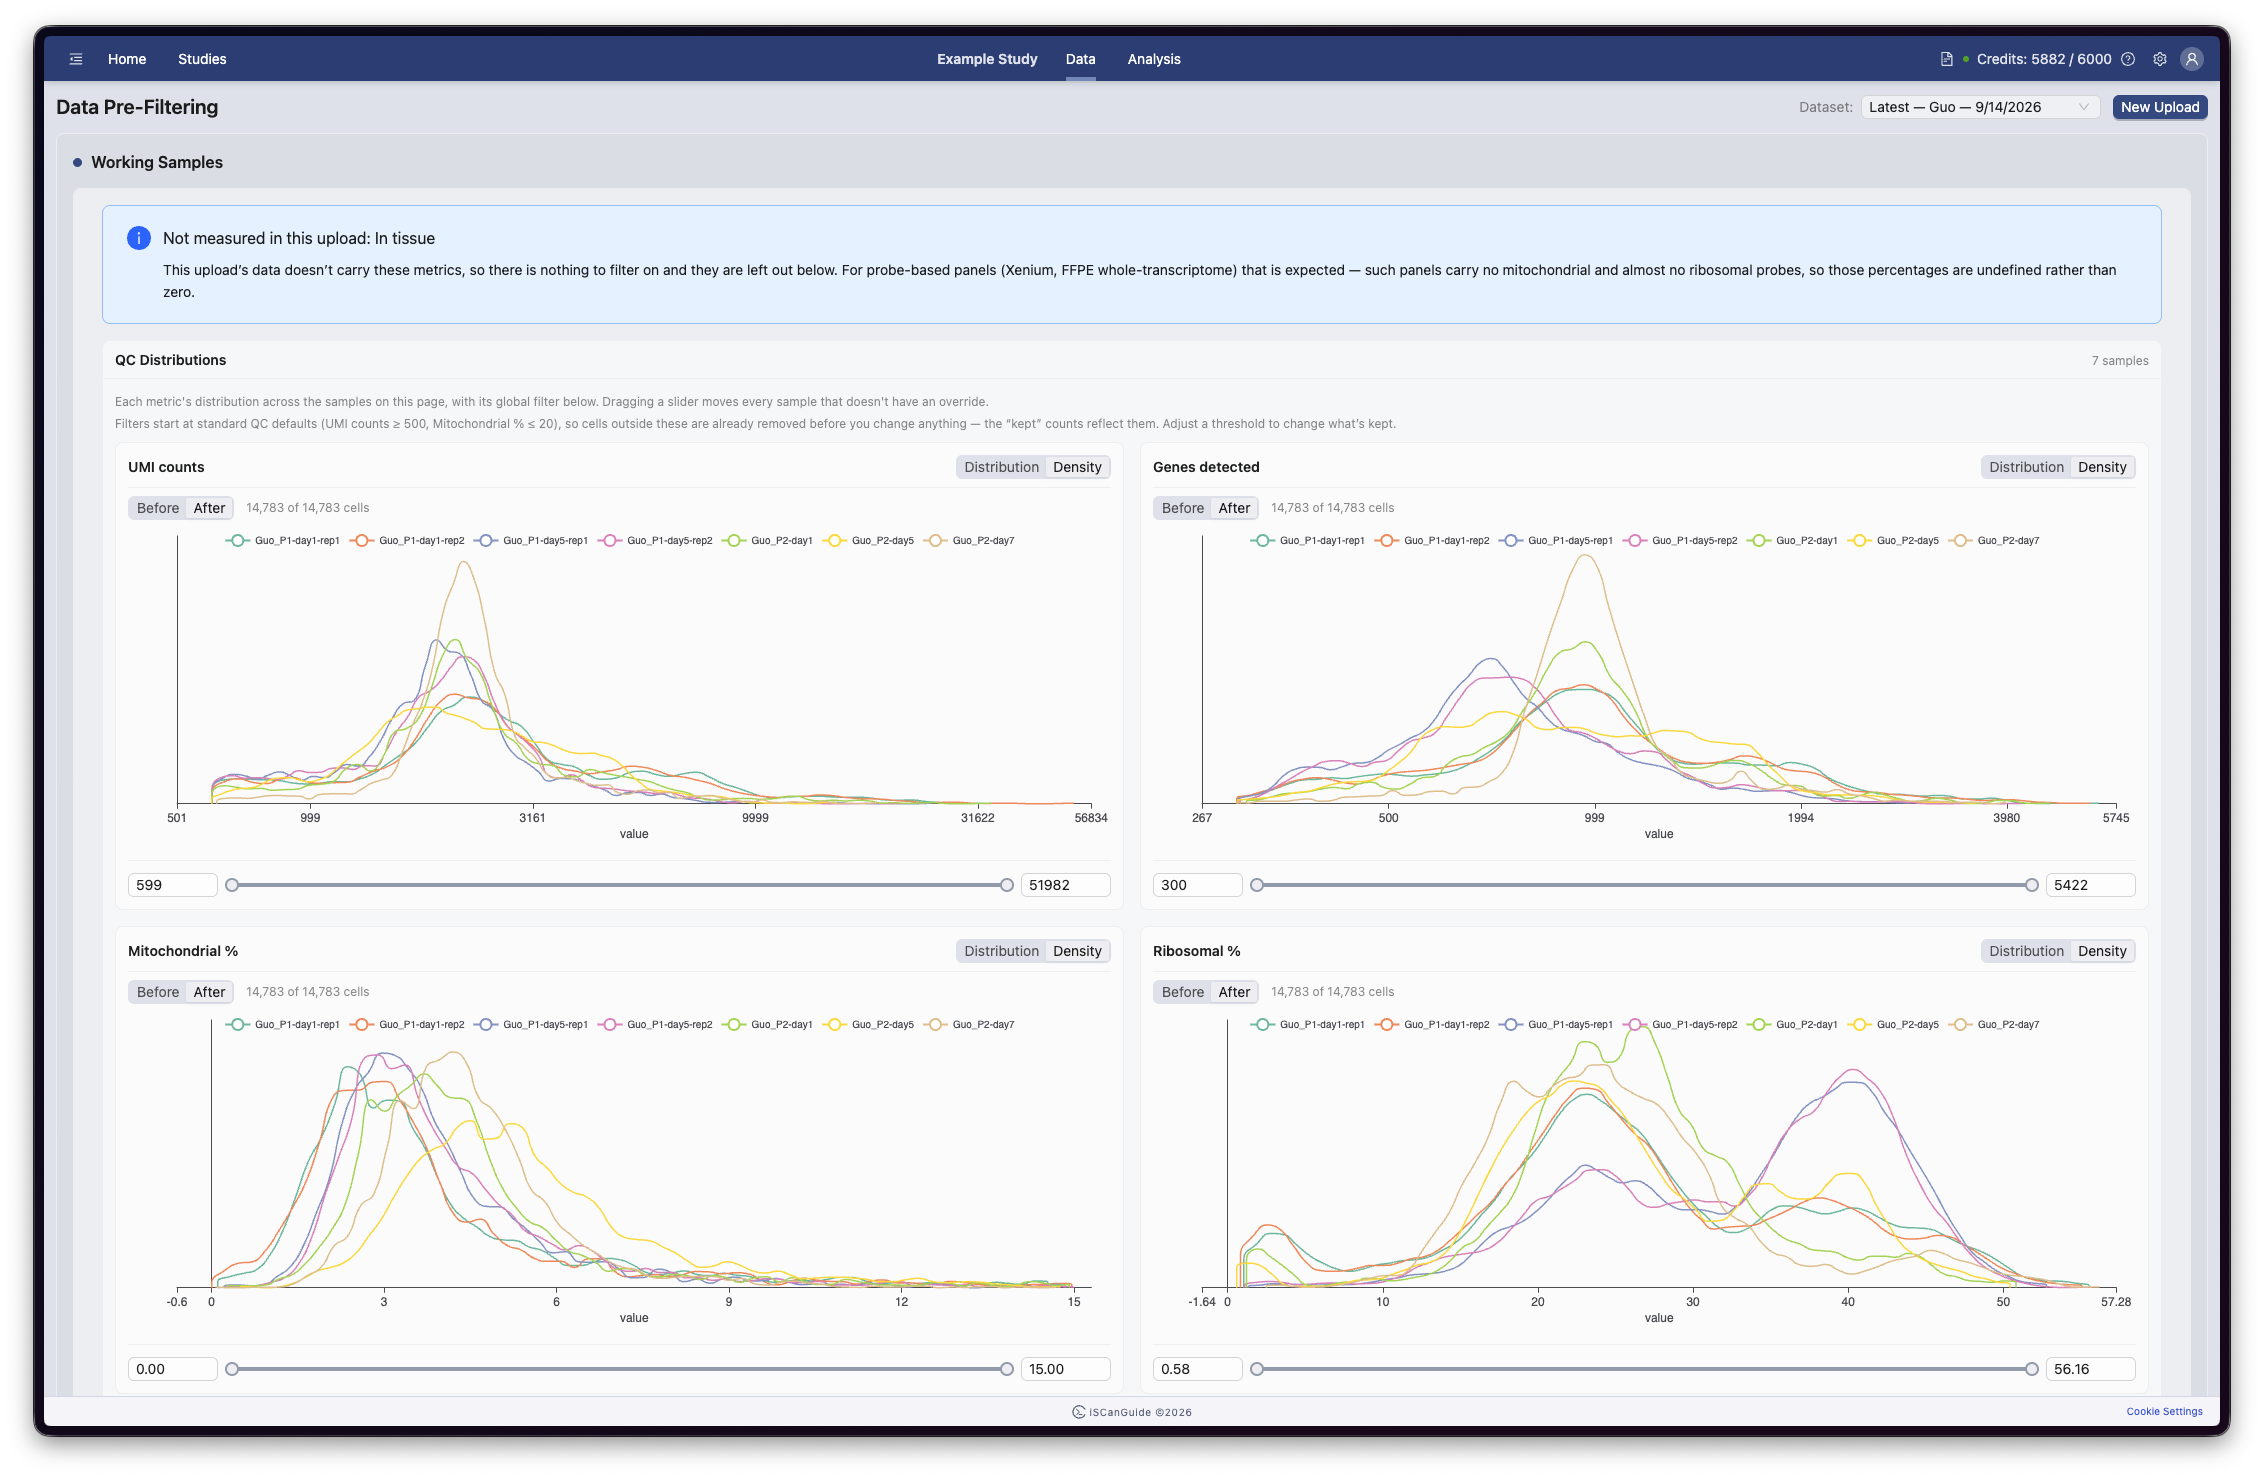
QC Distributions shows how each quality metric is distributed across cells, per sample. Filtering has already started: the thresholds open at standard QC defaults, so cells outside them are removed before you change anything and the kept counts reflect that. Review the distributions, then adjust the thresholds to change what is kept.
Reference
Each metric can be shown as a Distribution or a Density plot, and switched between Before and After to compare the effect of your filters.
If your data does not carry a metric, iSCanGuide says so rather than showing an empty control. Probe-based panels are the common case: they carry no mitochondrial and almost no ribosomal probes, so those percentages are undefined rather than zero.
14QC metrics by data type
The available metrics depend on your data type. Single-cell data is filtered on UMI counts, genes detected, and mitochondrial and ribosomal percentages. Imaging data types add transcript counts, control probe counts, and cell and nucleus area.
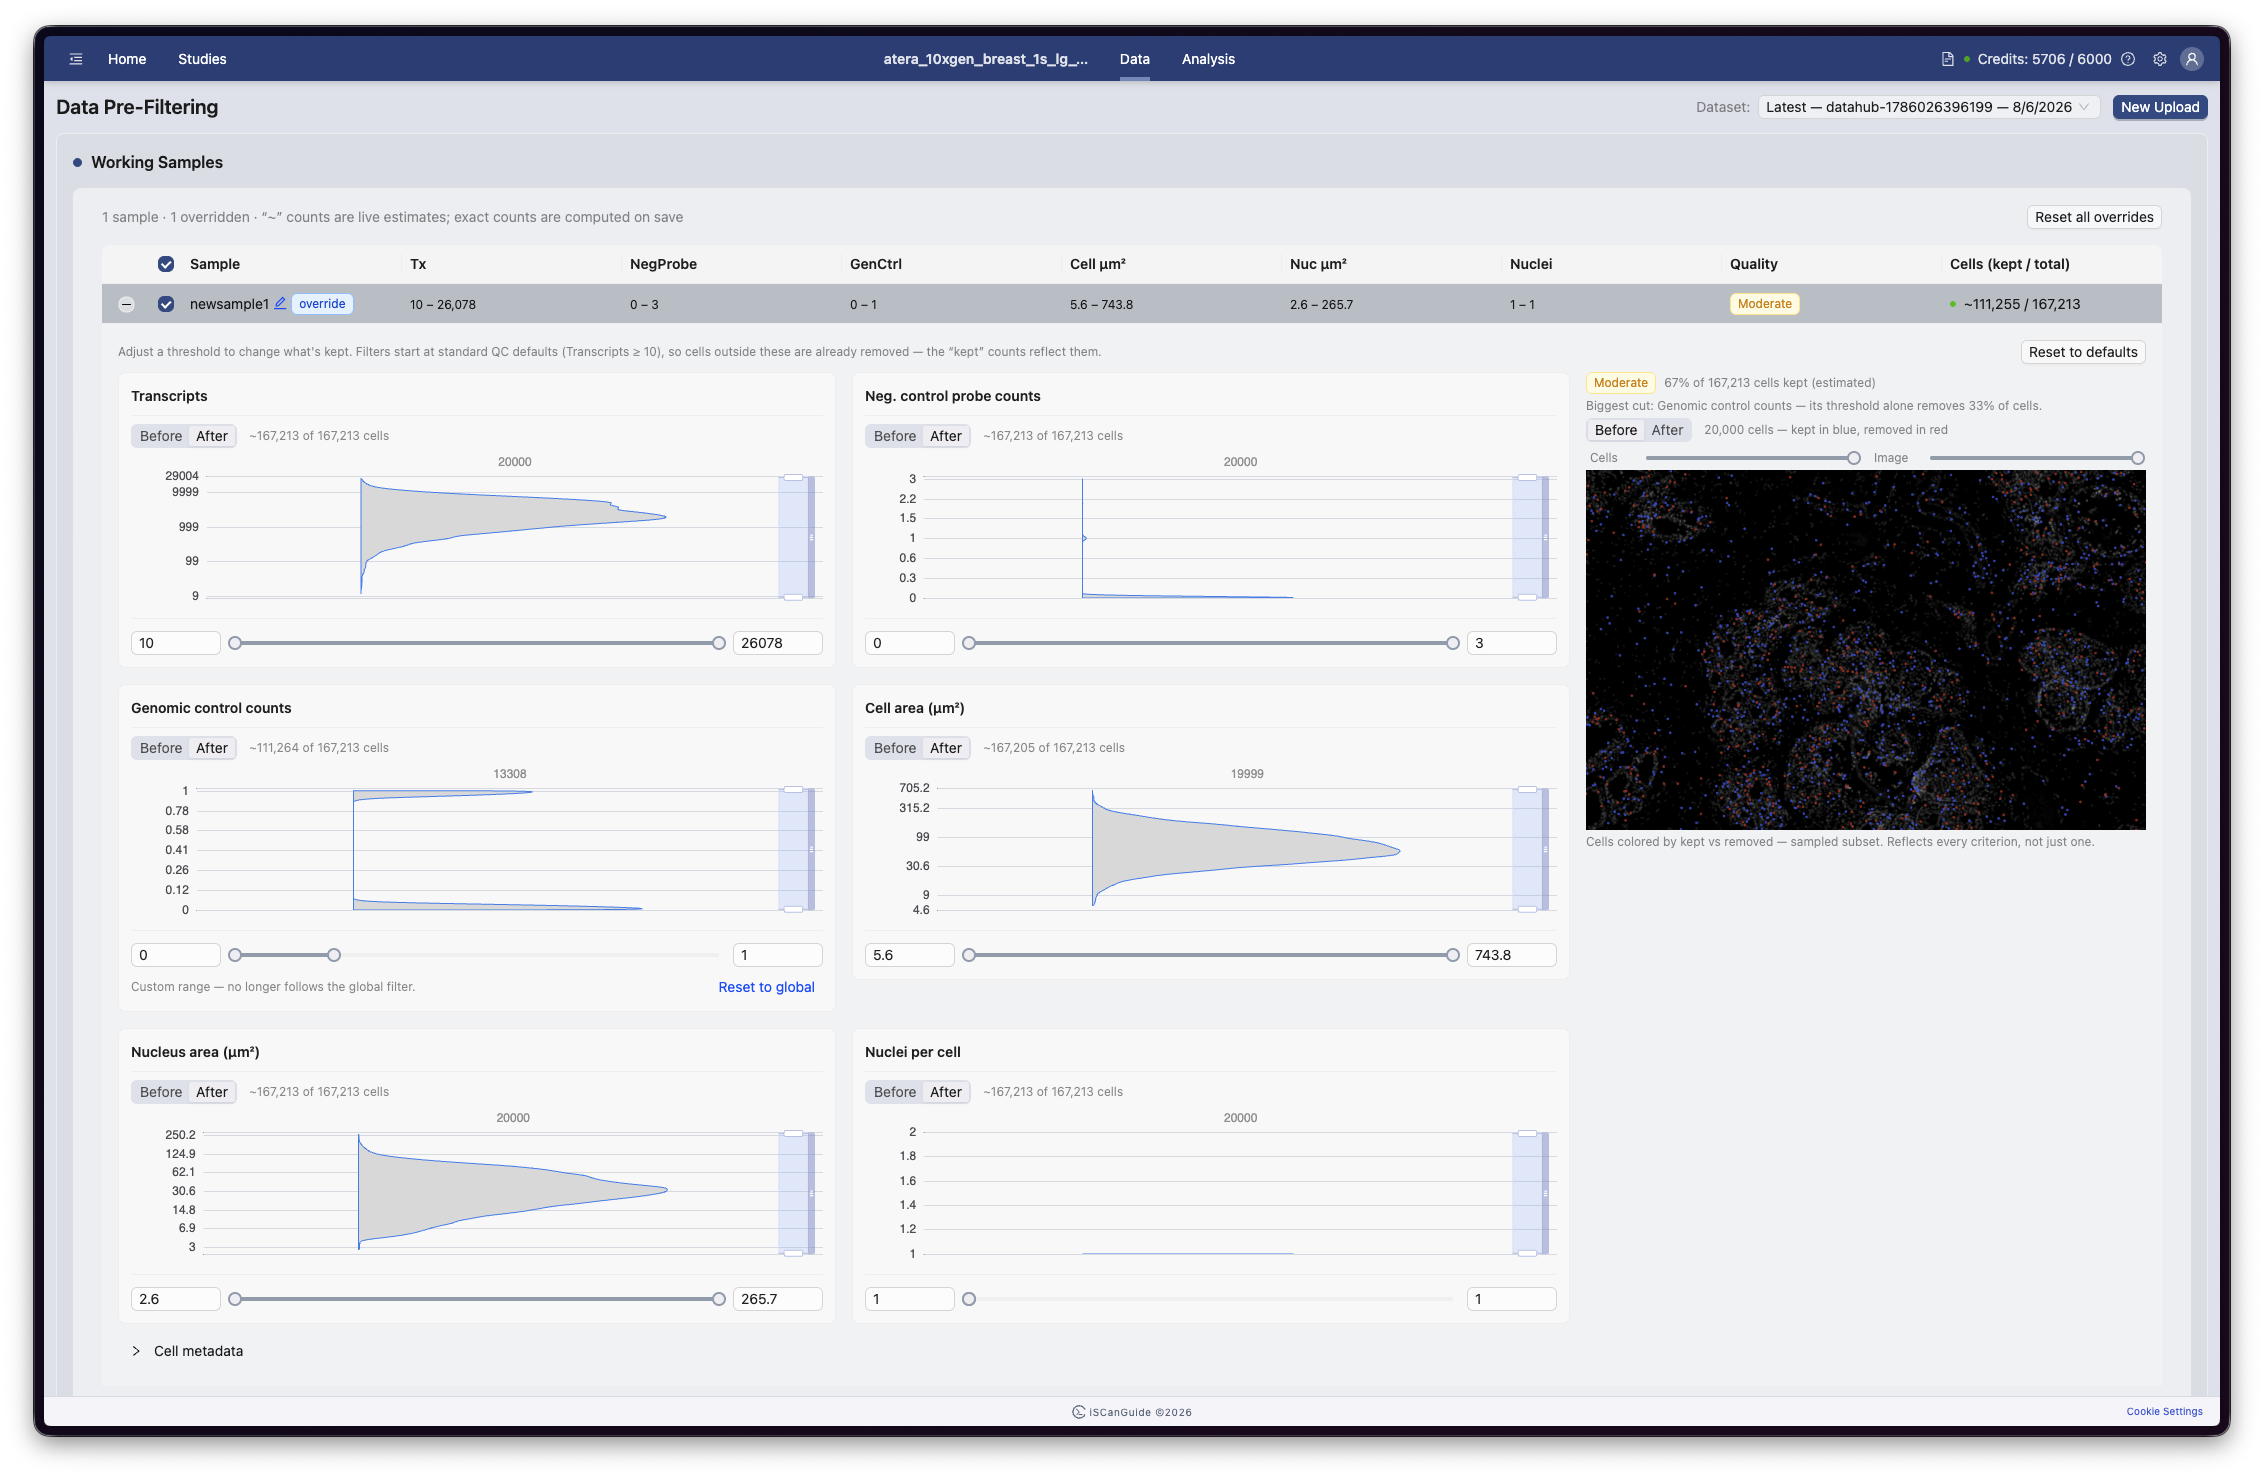
Metrics by data type
- Single-cell:
UMI counts,Genes detected,Mitochondrial %,Ribosomal % - Imaging and spatial:
Transcripts,Neg. control probe counts,
Neg. control codeword counts, Genomic control counts, Unassigned codeword counts, Cell area (µm²), Nucleus area (µm²), Nuclei per cell, In tissue
15Set filtering thresholds
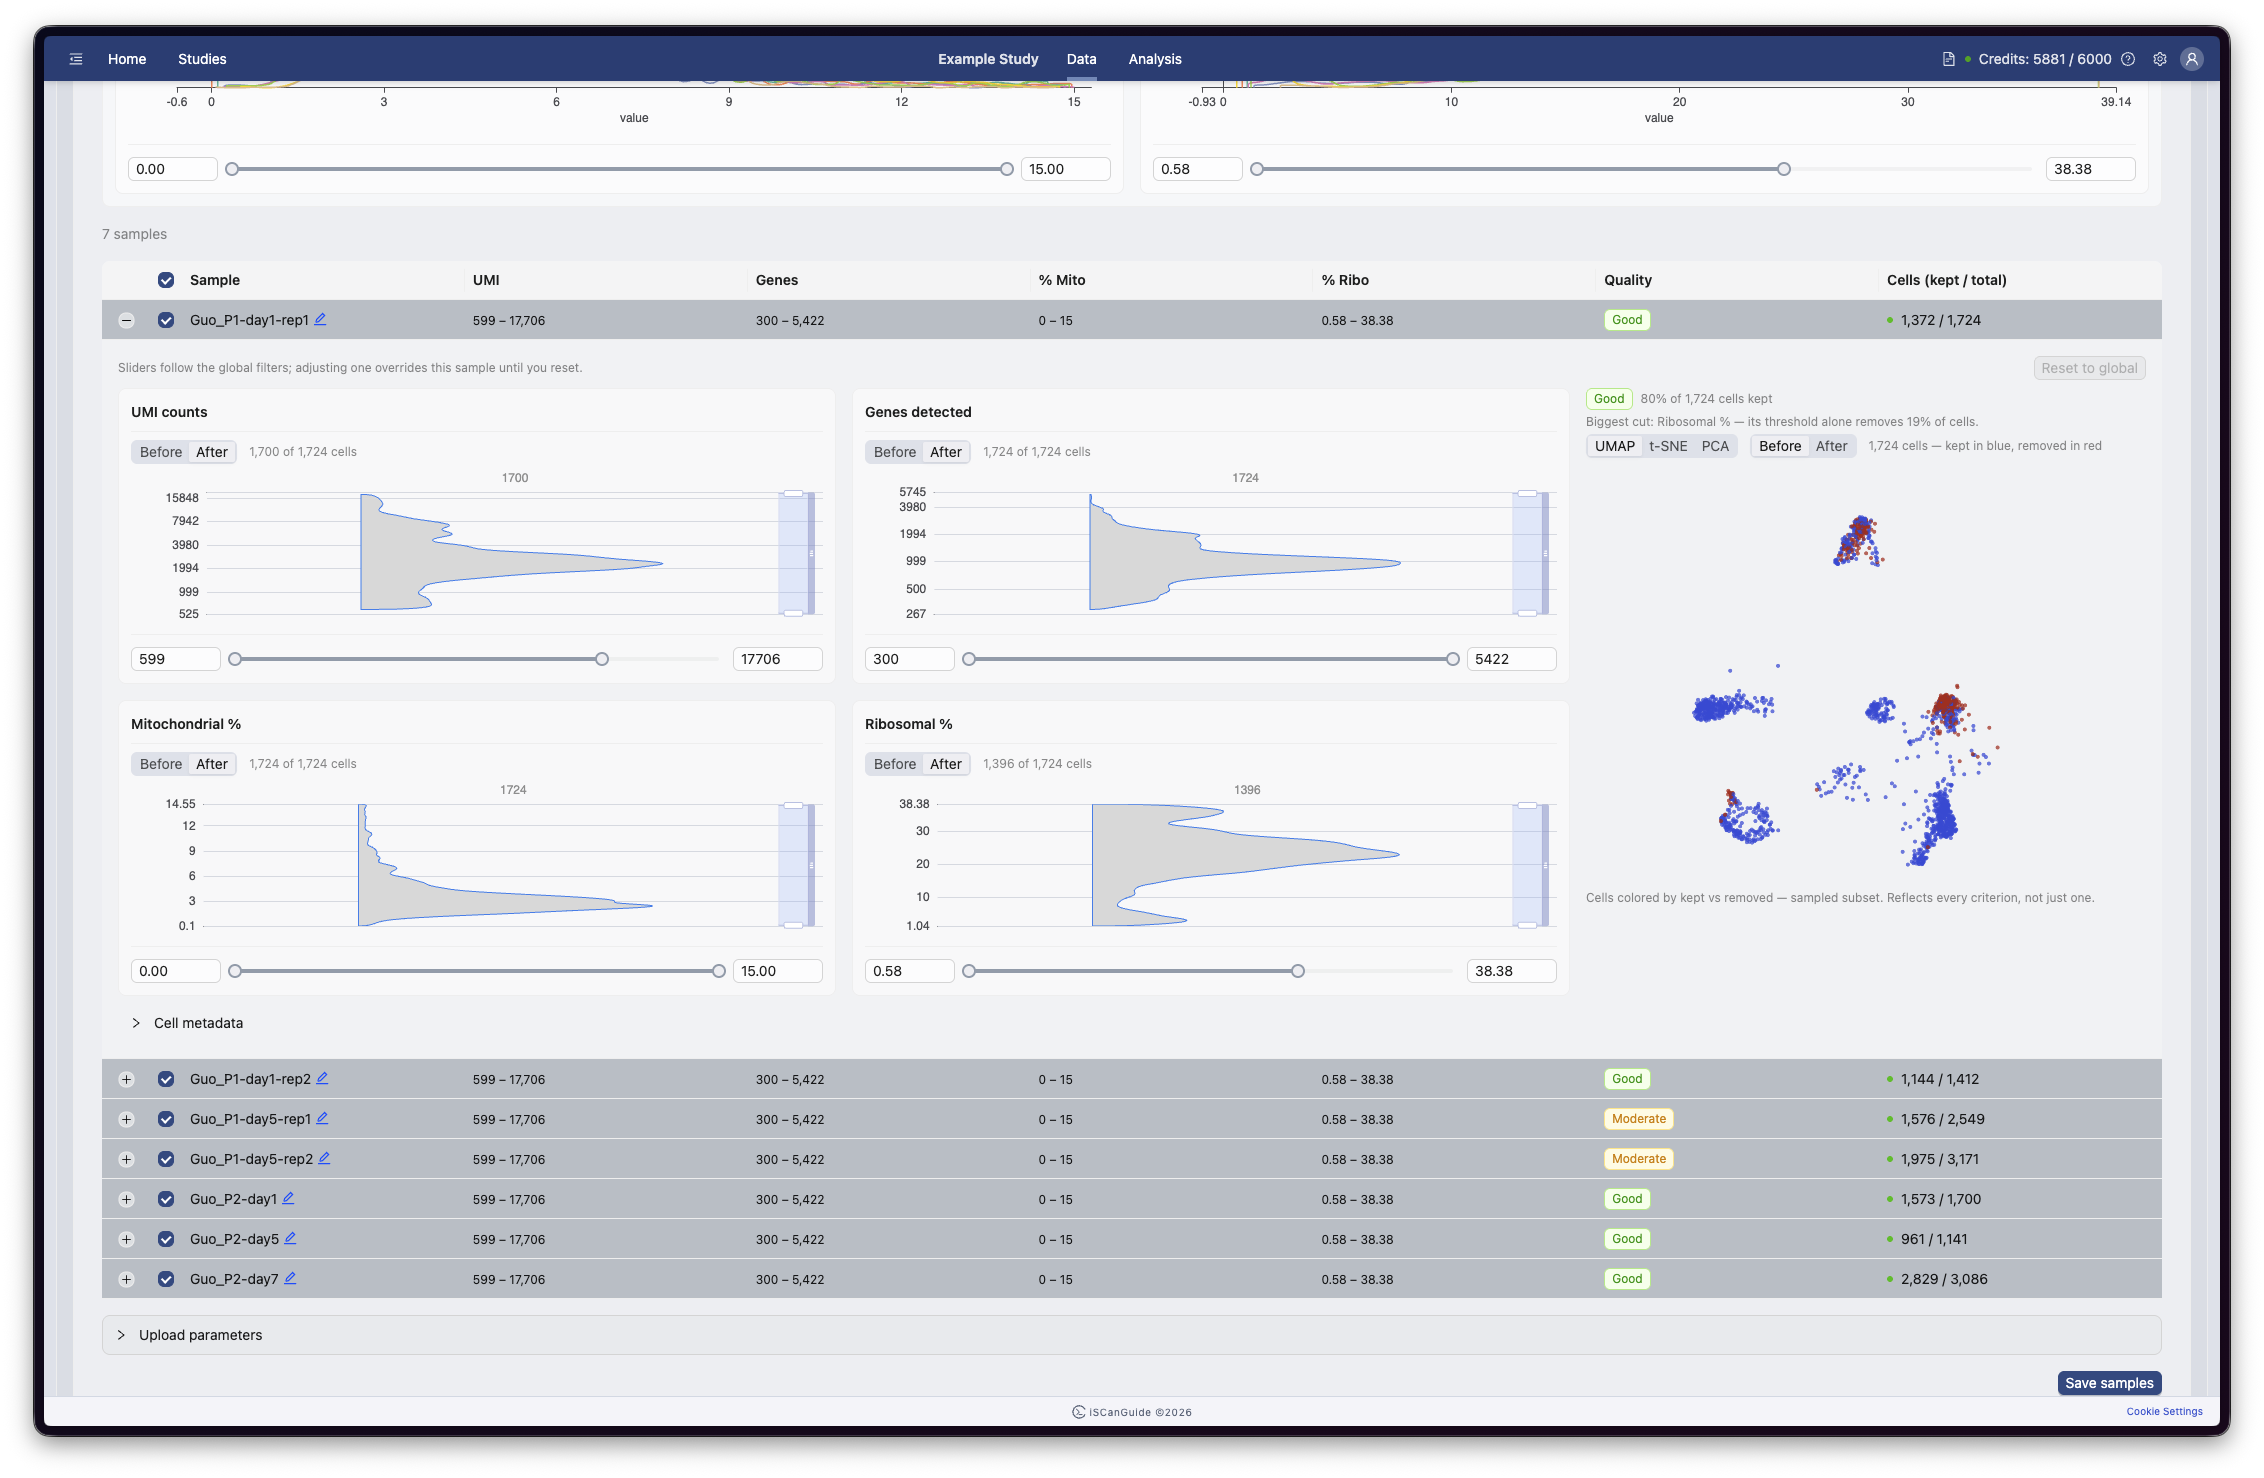
The thresholds at the top apply to every sample at once. Scroll down and you can set limits for a single sample instead, where one needs treating differently. The kept-cell count updates as you drag.
16Sample quality
Each sample is graded Good, Moderate or Poor, based on the proportion of its cells your filters retain. A Poor grade means most of the sample is being discarded.
17Tissue image
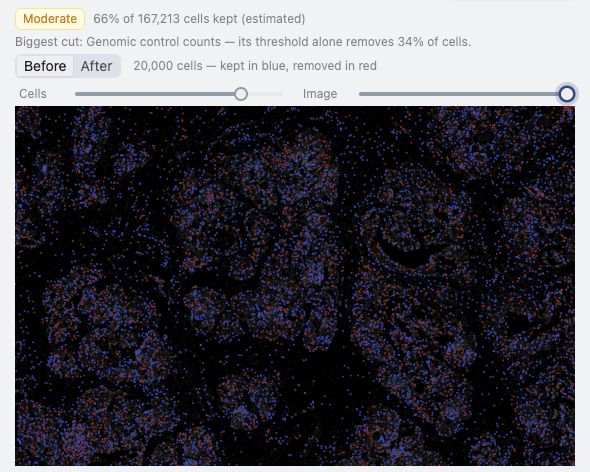
For spatial data, the tissue image is shown with your cells overlaid. Adjust the overlay to see how your filters affect the tissue, and export the view if you want to keep it.
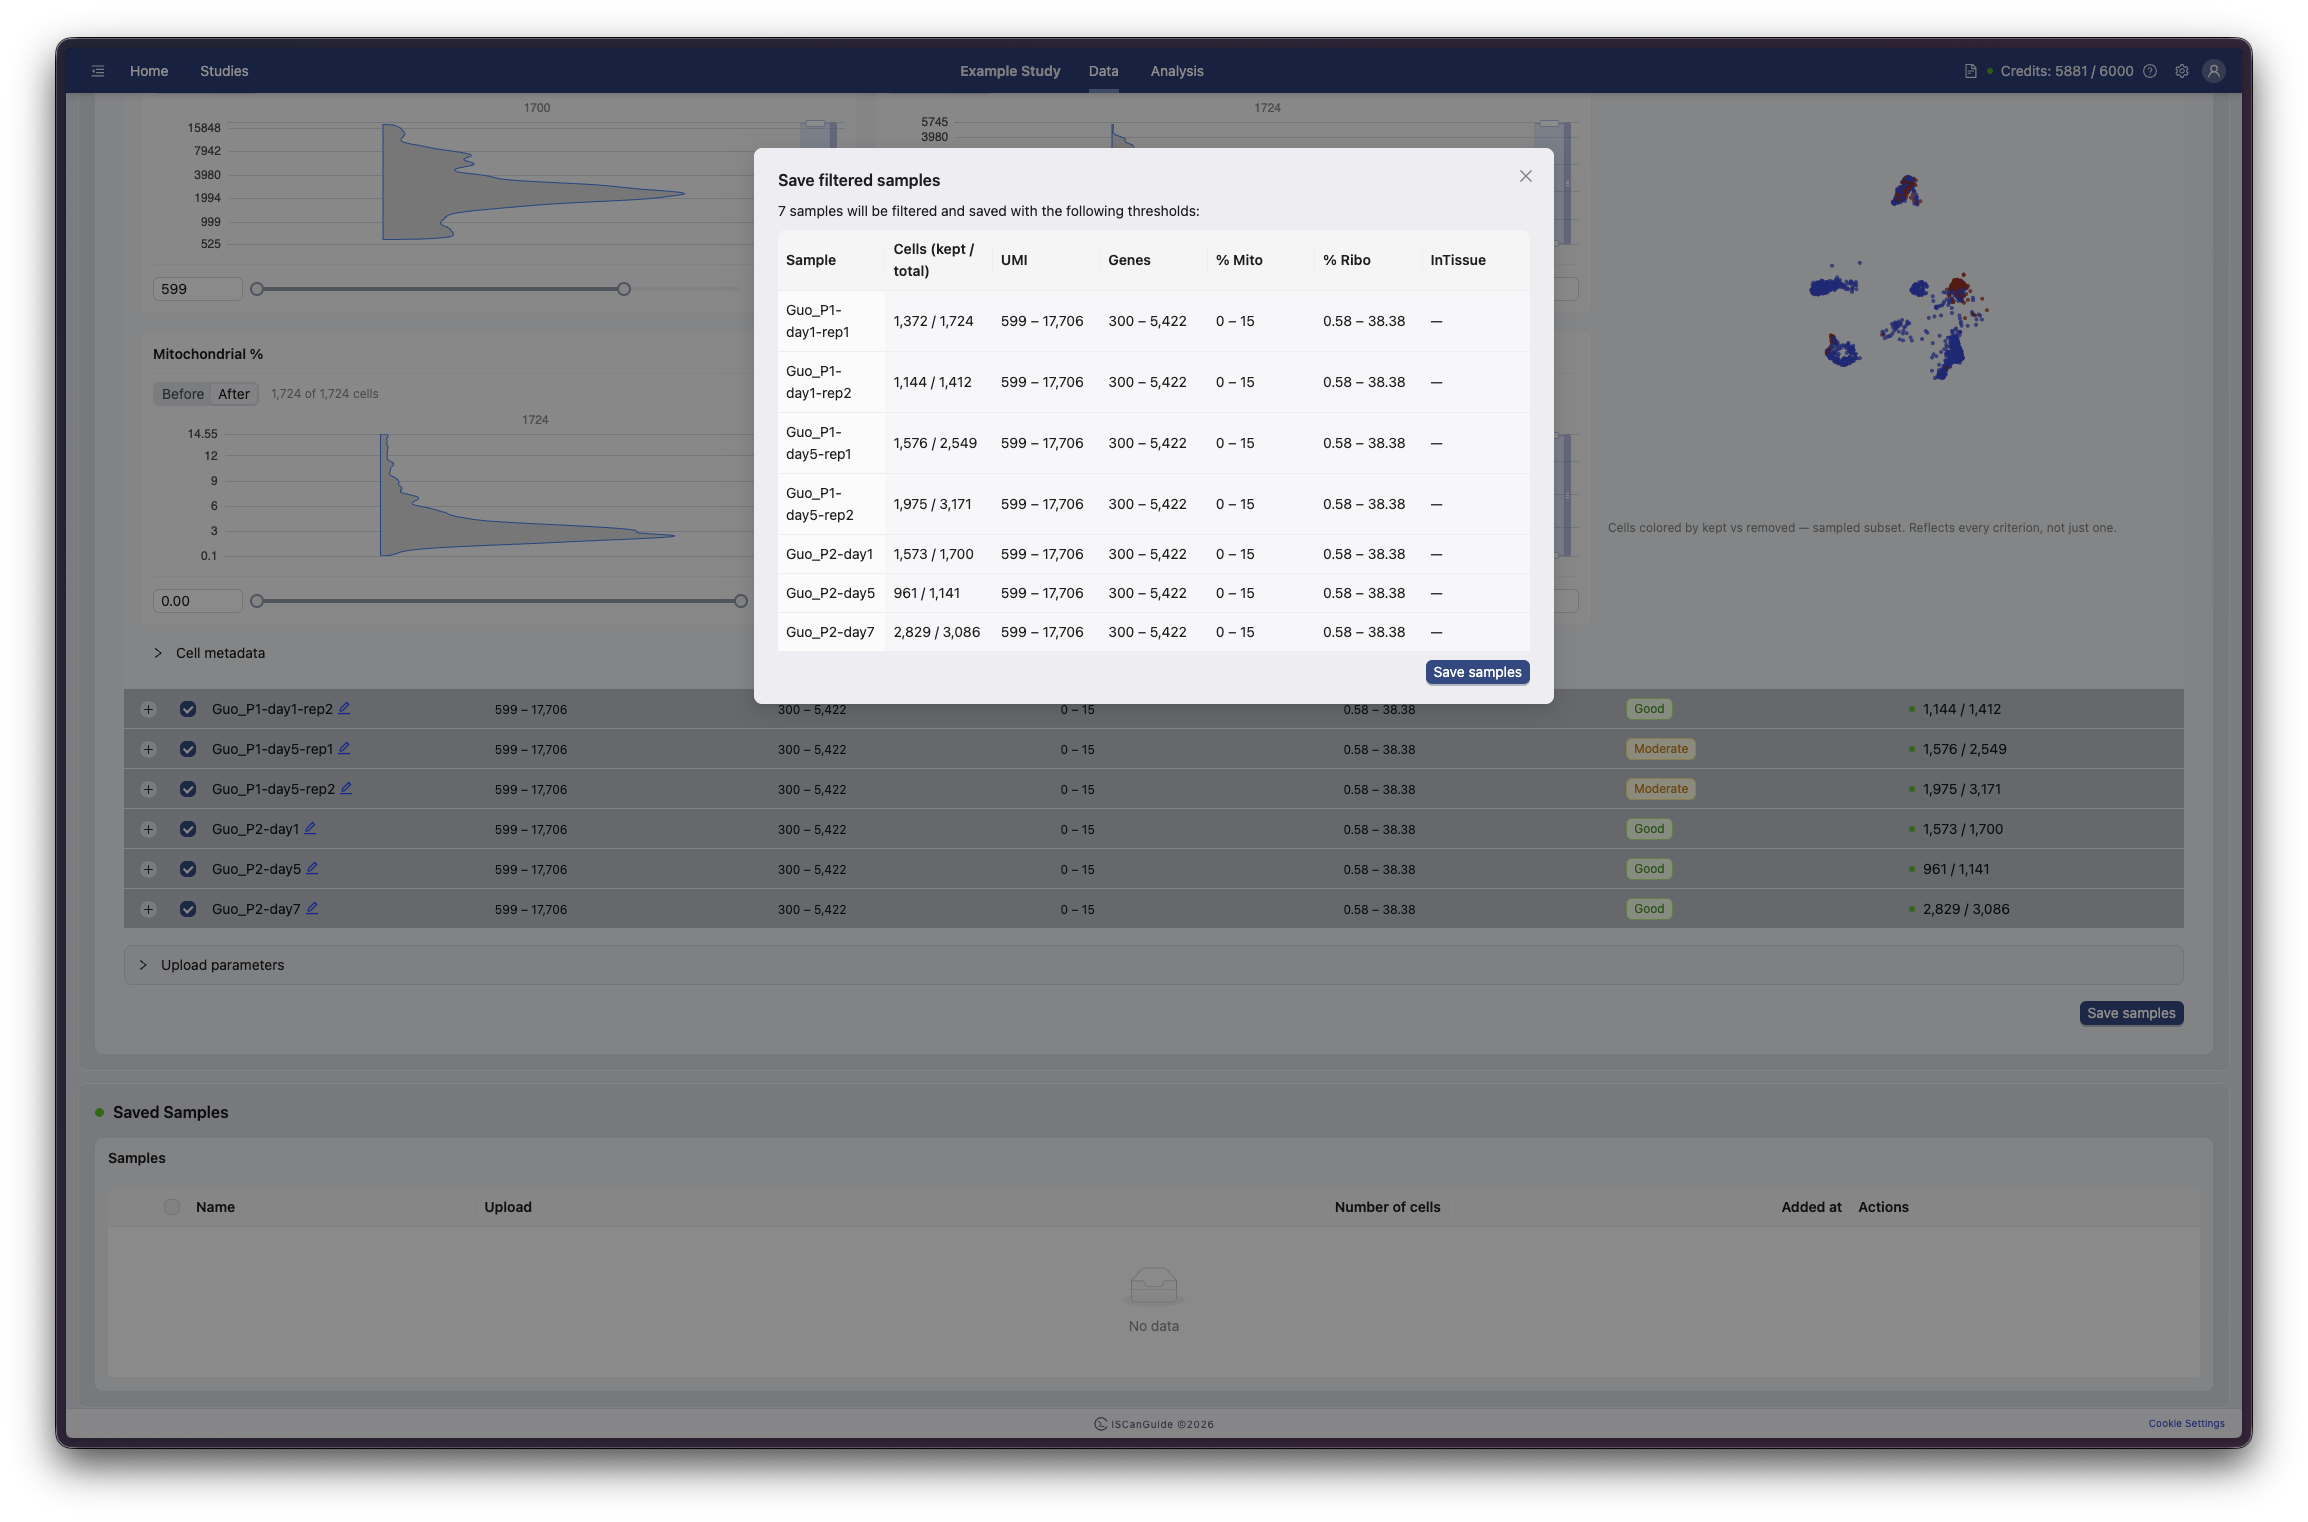
18Save filtered samples
Save once the filtering is right. iSCanGuide shows how many cells each sample retains before anything is committed.
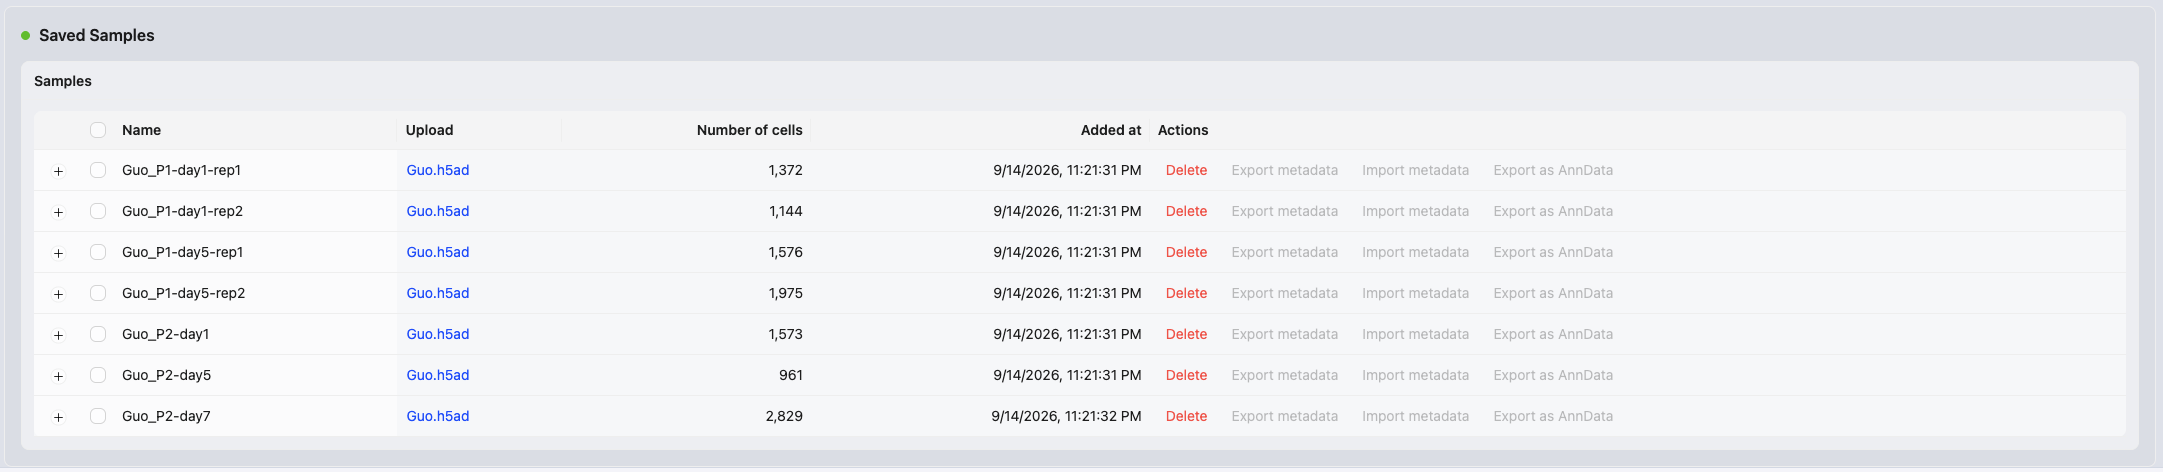
19Saved samples
Saved samples move to Saved Samples and are available for analysis. You can rename a sample, review the criteria it was saved with, or reopen its upload to change the filters.
20Export samples
Export a sample when you want to take it elsewhere. Choose a file name, then pick the metadata, embeddings, clusterings and annotations to include.