Differential Expression
Shows how to compare two groups of cells to find the genes that separate them: defining the groups, choosing a method, reading the results table and volcano plot, and saving genes to a gene set.
1Open the Differential Expression tab
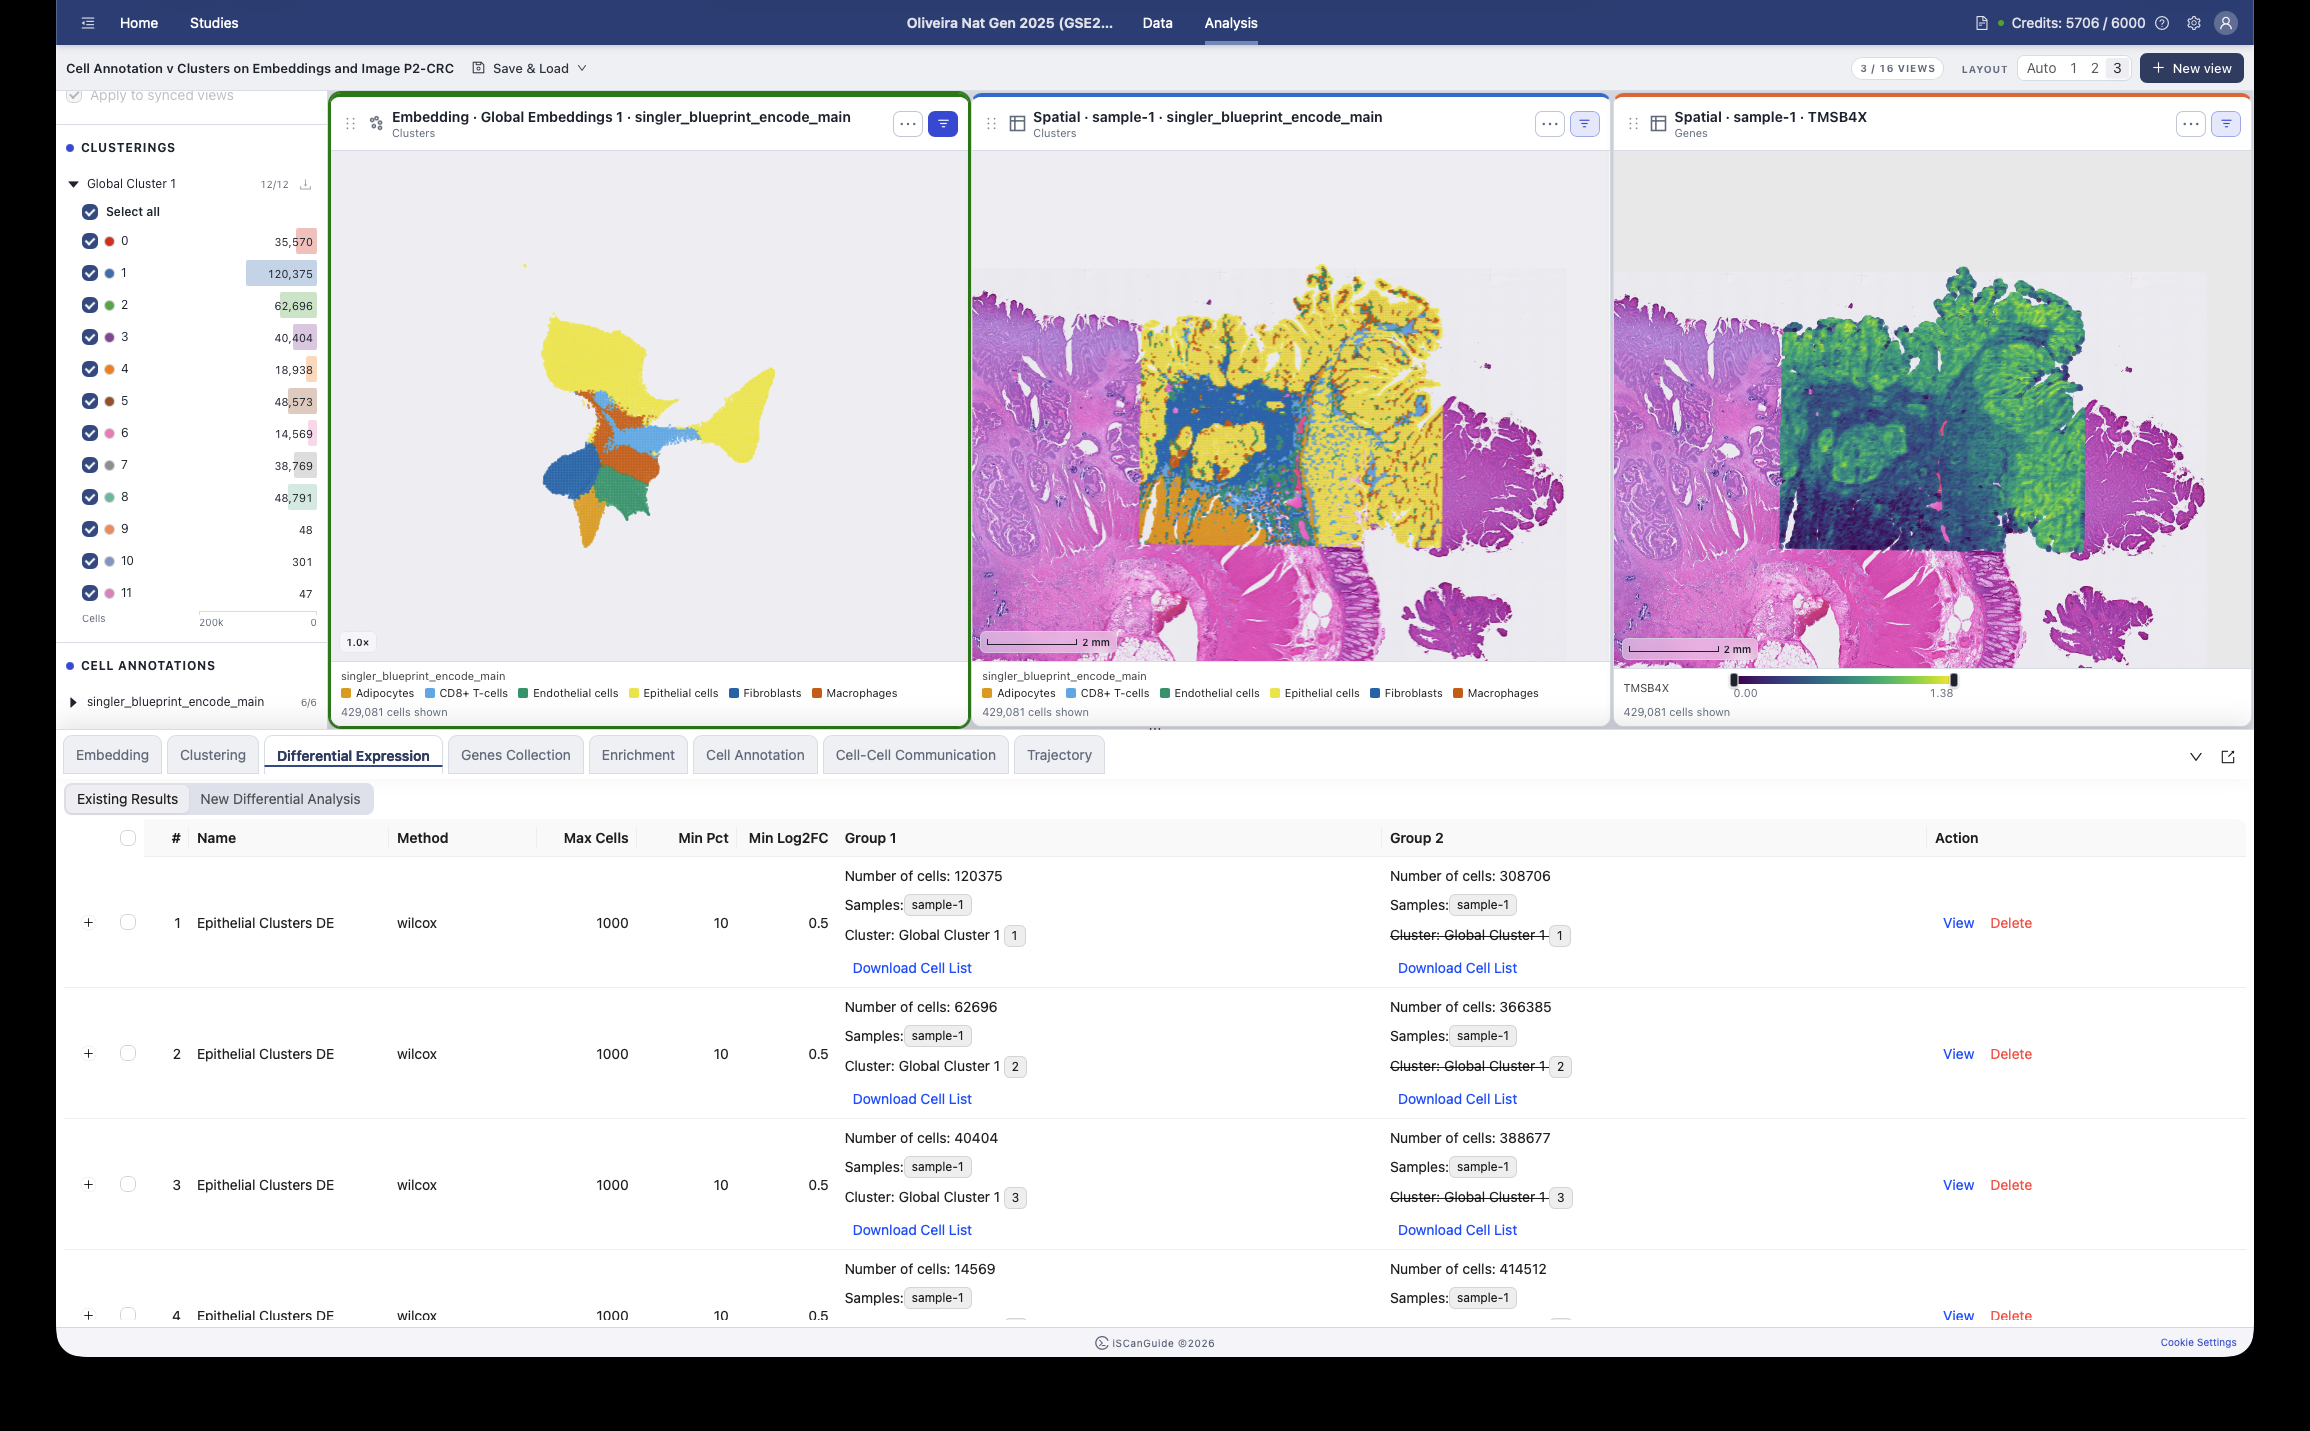
Open Differential Expression in the bottom drawer. This finds the genes expressed differently between two groups of cells.
2Choose how to define your groups
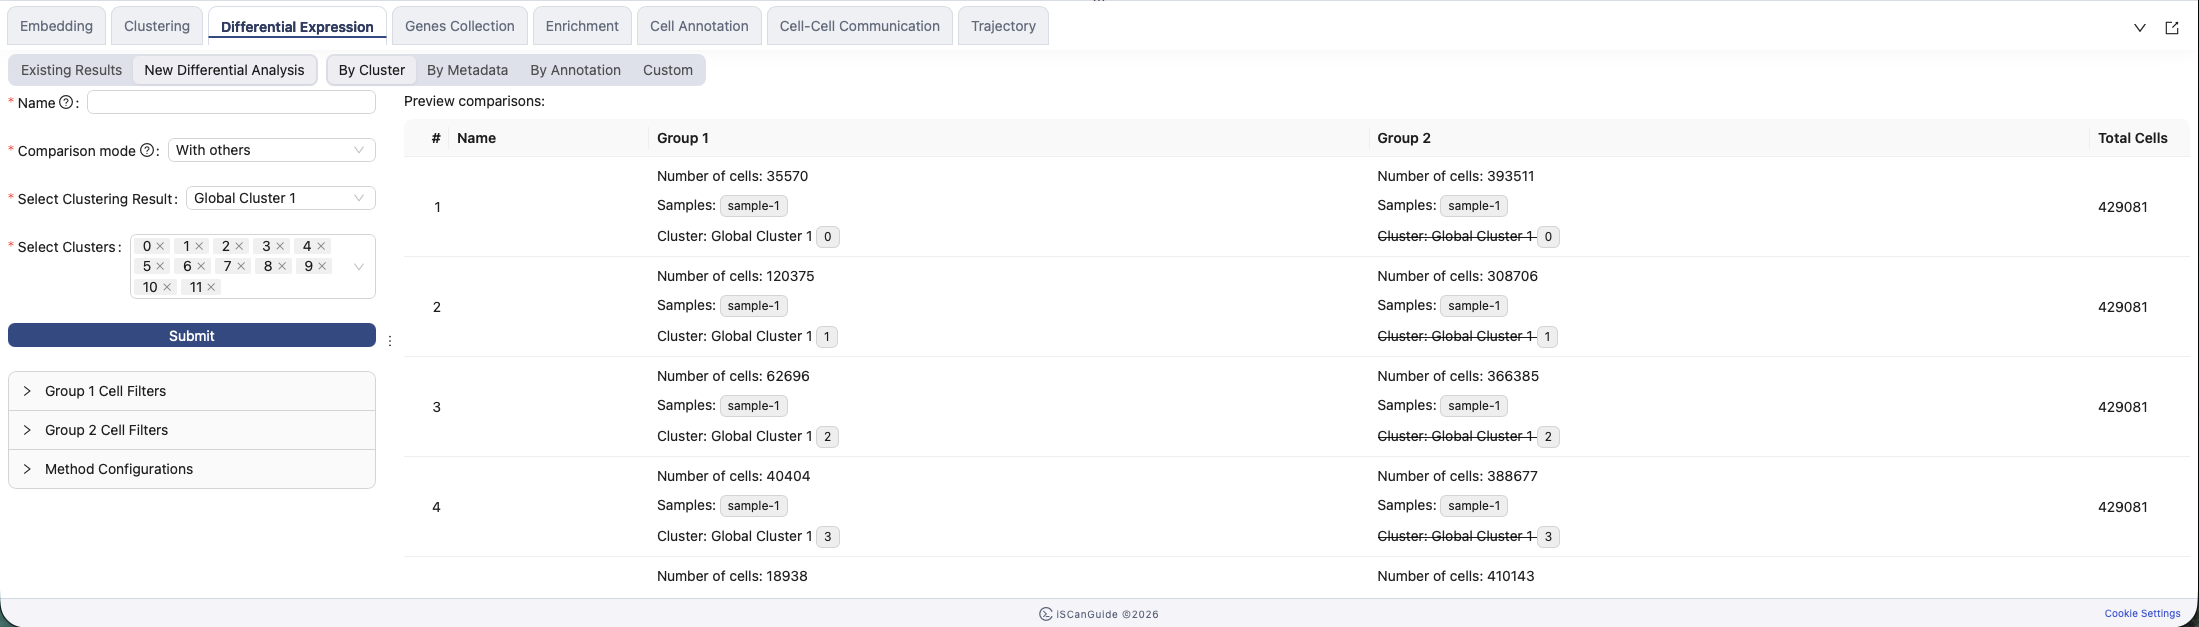
Define your groups by cluster, metadata value, or annotation. Custom lets you build each group from its own filters.
3Name the analysis
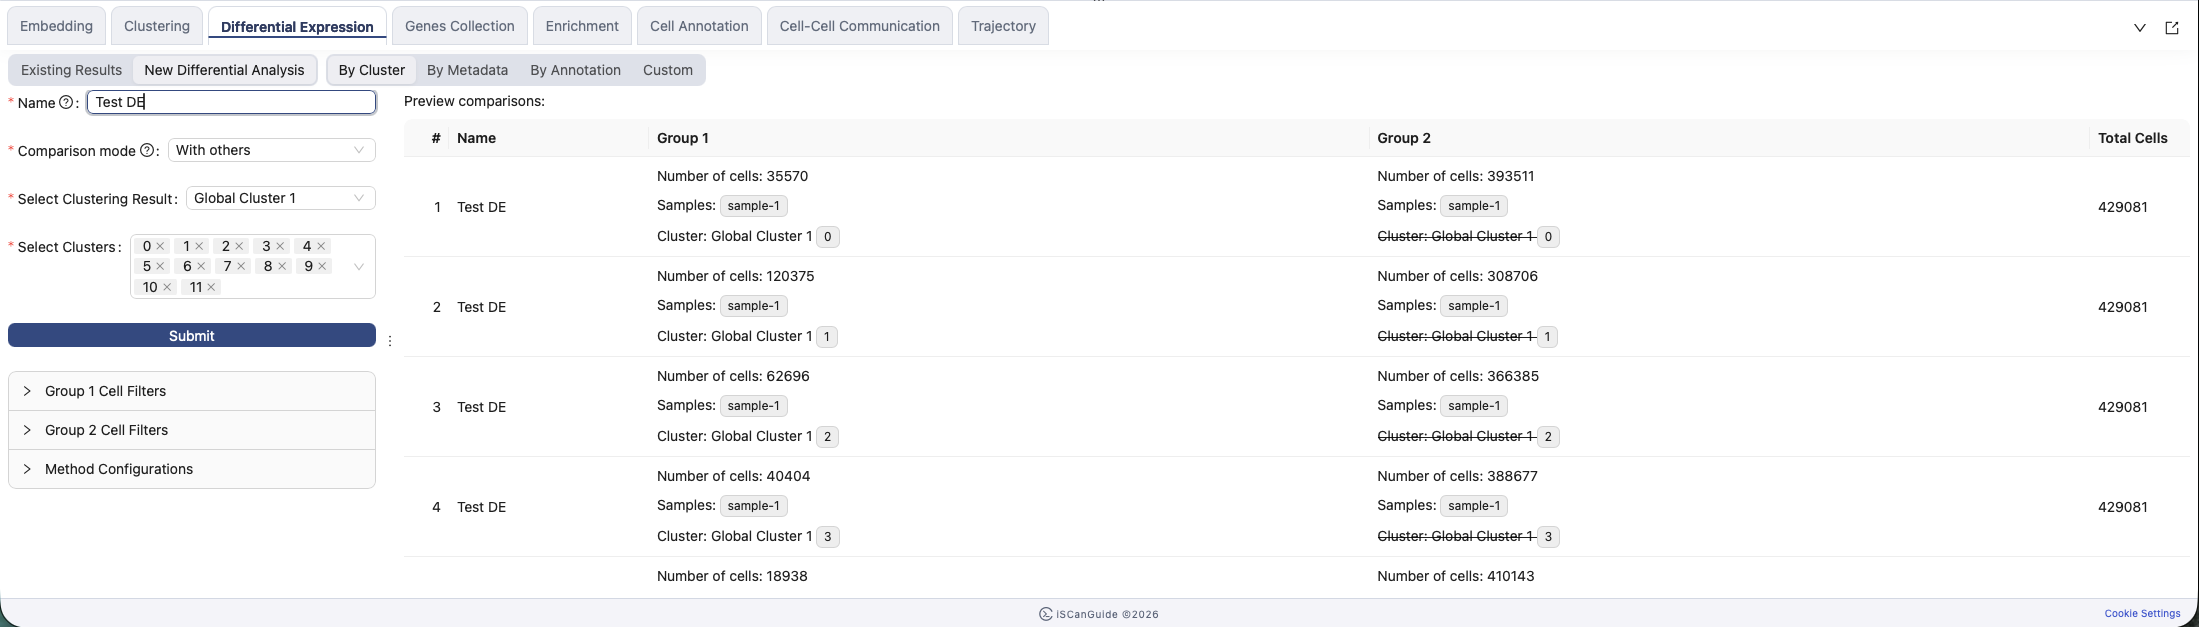
Name the analysis. Depending on how you defined your groups, {cluster}, {metadata} or {sample} are replaced with the actual values.
4Choose what to compare against
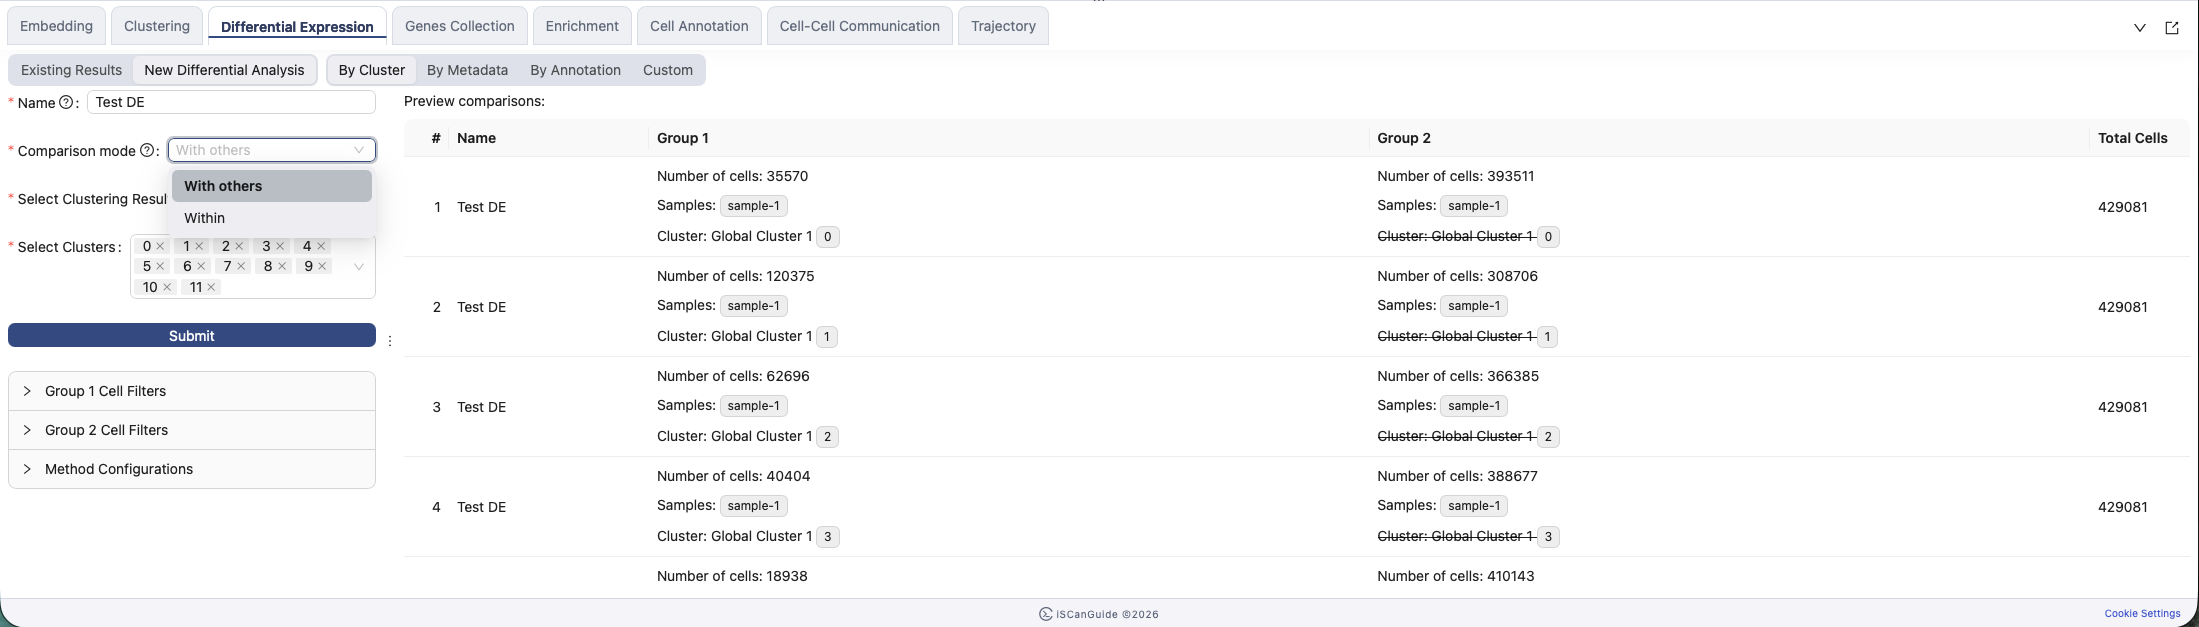
With others compares each group against all remaining cells. Within compares your selected groups against each other.
5Define group 1 and group 2
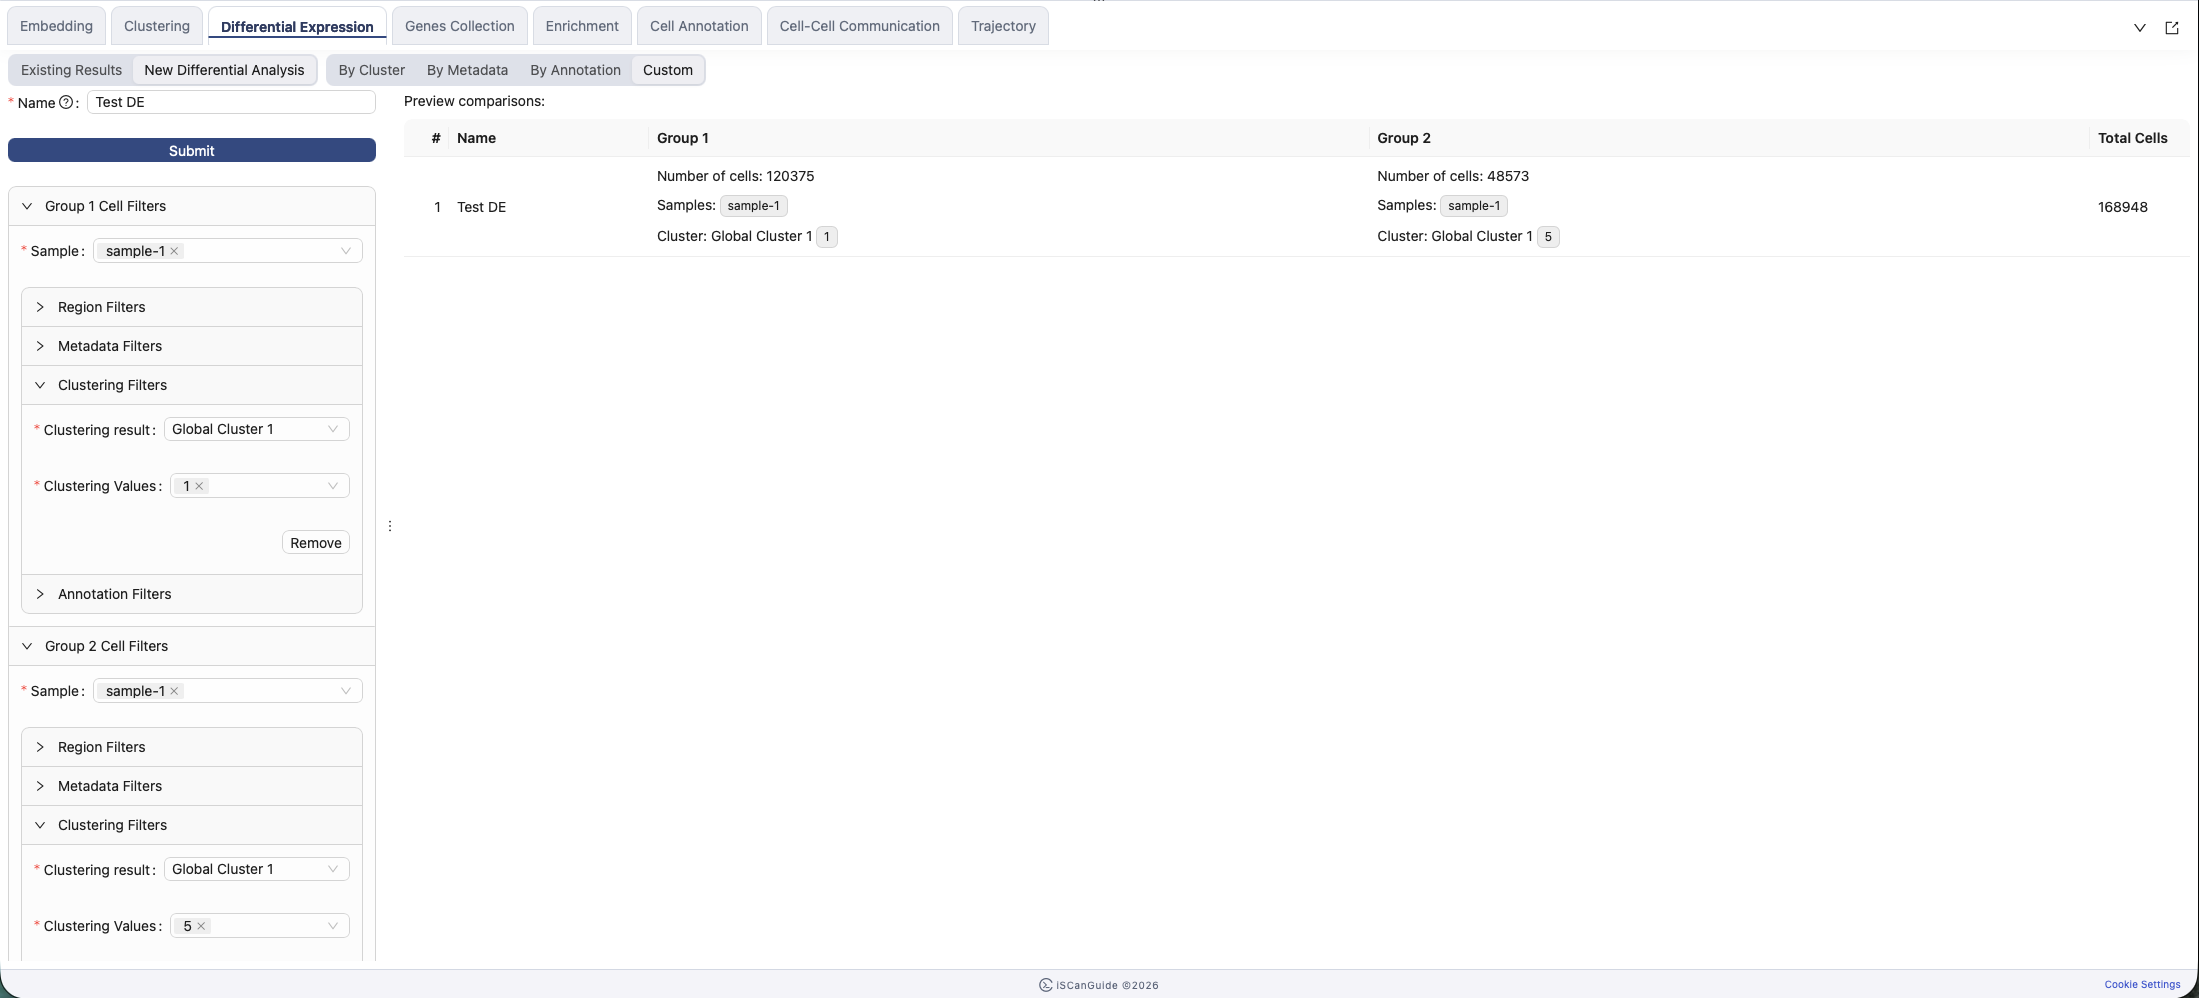
In Custom mode each group gets its own filters, so you can compare any two sets of cells: two metadata values, a region you drew against a cluster, or any combination.
6Choose a method
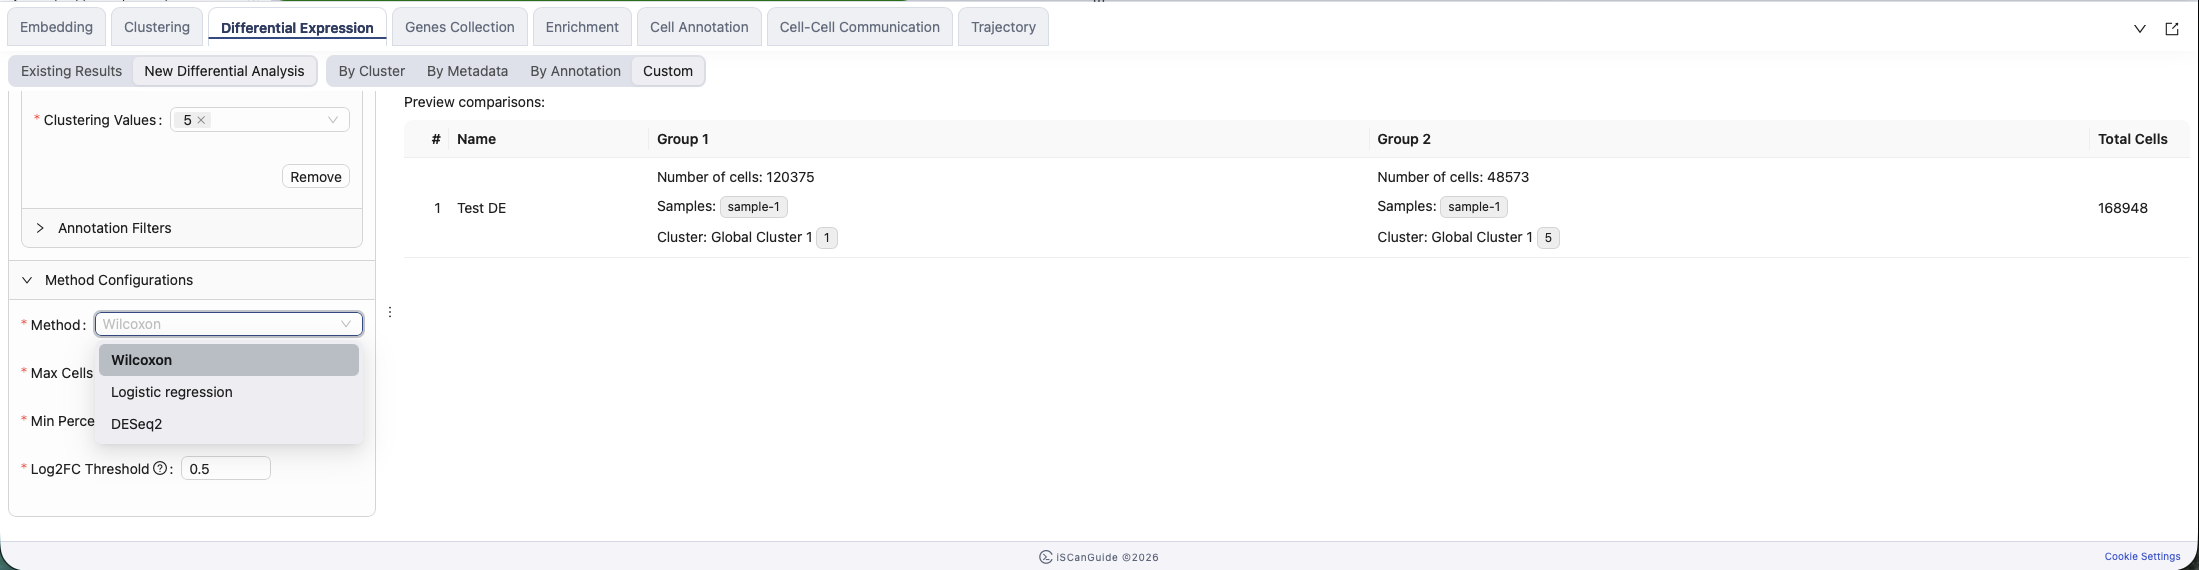
Wilcoxon is the default and suits most comparisons. Logistic regression and DESeq2 are also available. DESeq2 needs a sample identifier so it can model replicates.
7Method parameters
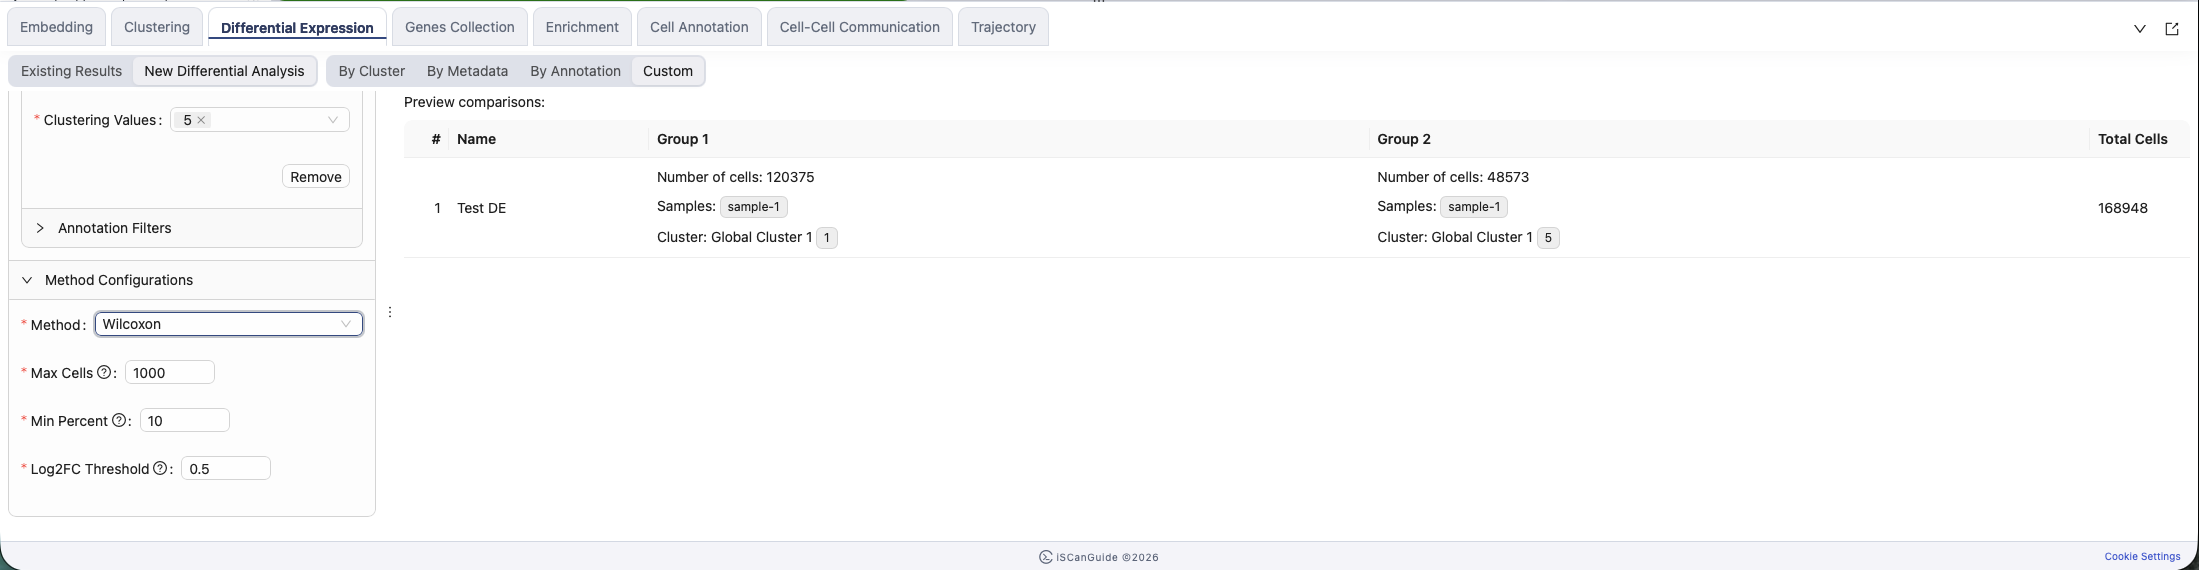
Max Cells downsamples large groups. Min Percent drops genes expressed in too few cells. Log2FC Threshold sets the smallest effect worth reporting.
Parameters
| Field | Default | Range | What it does |
|---|---|---|---|
Max Cells | 1,000 | 10 to 100,000 | Groups larger than this are downsampled |
Min Percent | 10 | 0 to 100 | Genes expressed in fewer cells than this are removed |
Log2FC Threshold | 0.5 | 0 to 100, step 0.5 | Minimum fold change considered |
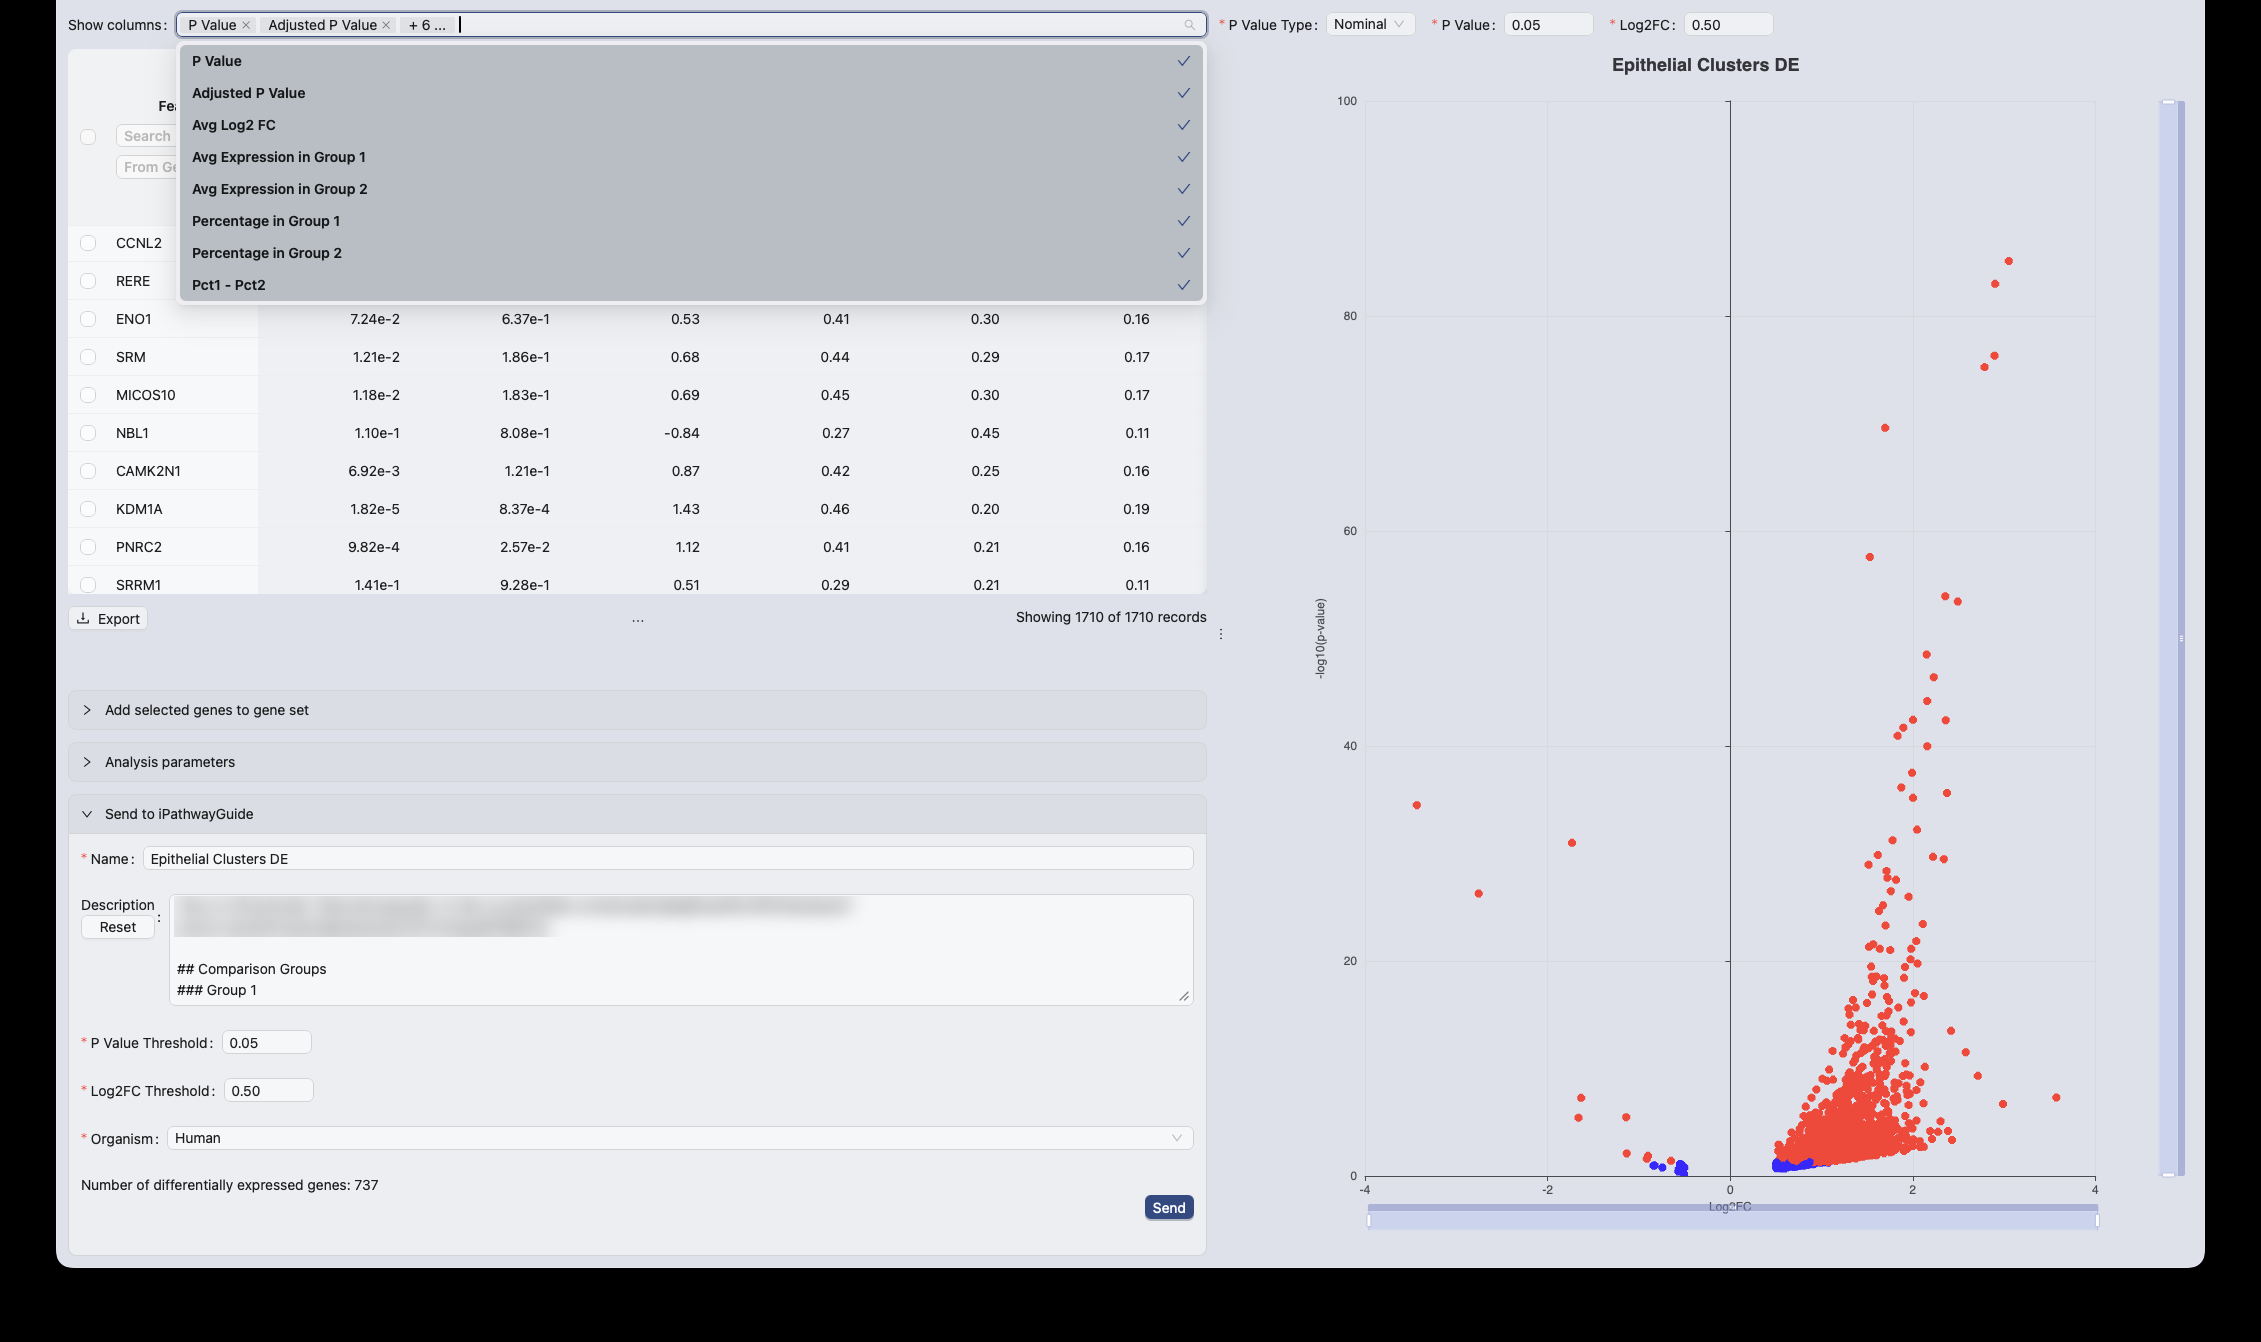
8Read the results table
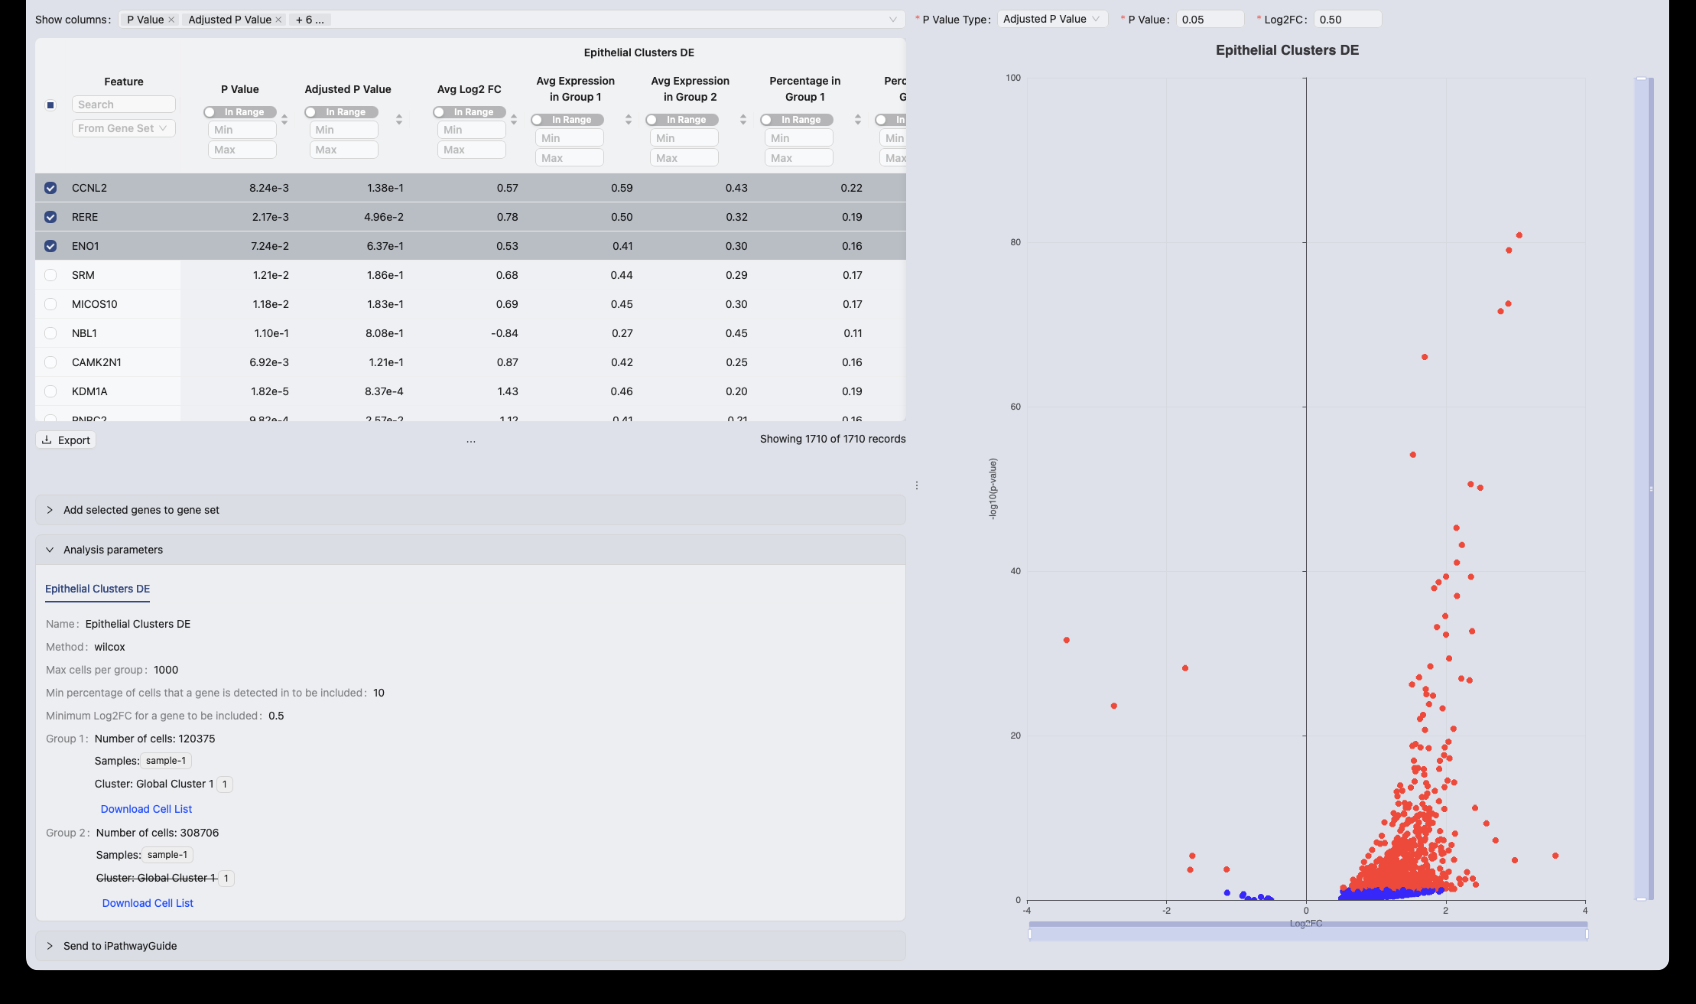
Results list one row per gene, with fold change and significance. Sort and filter to find the genes you care about, and use Show columns to choose which statistics are shown.
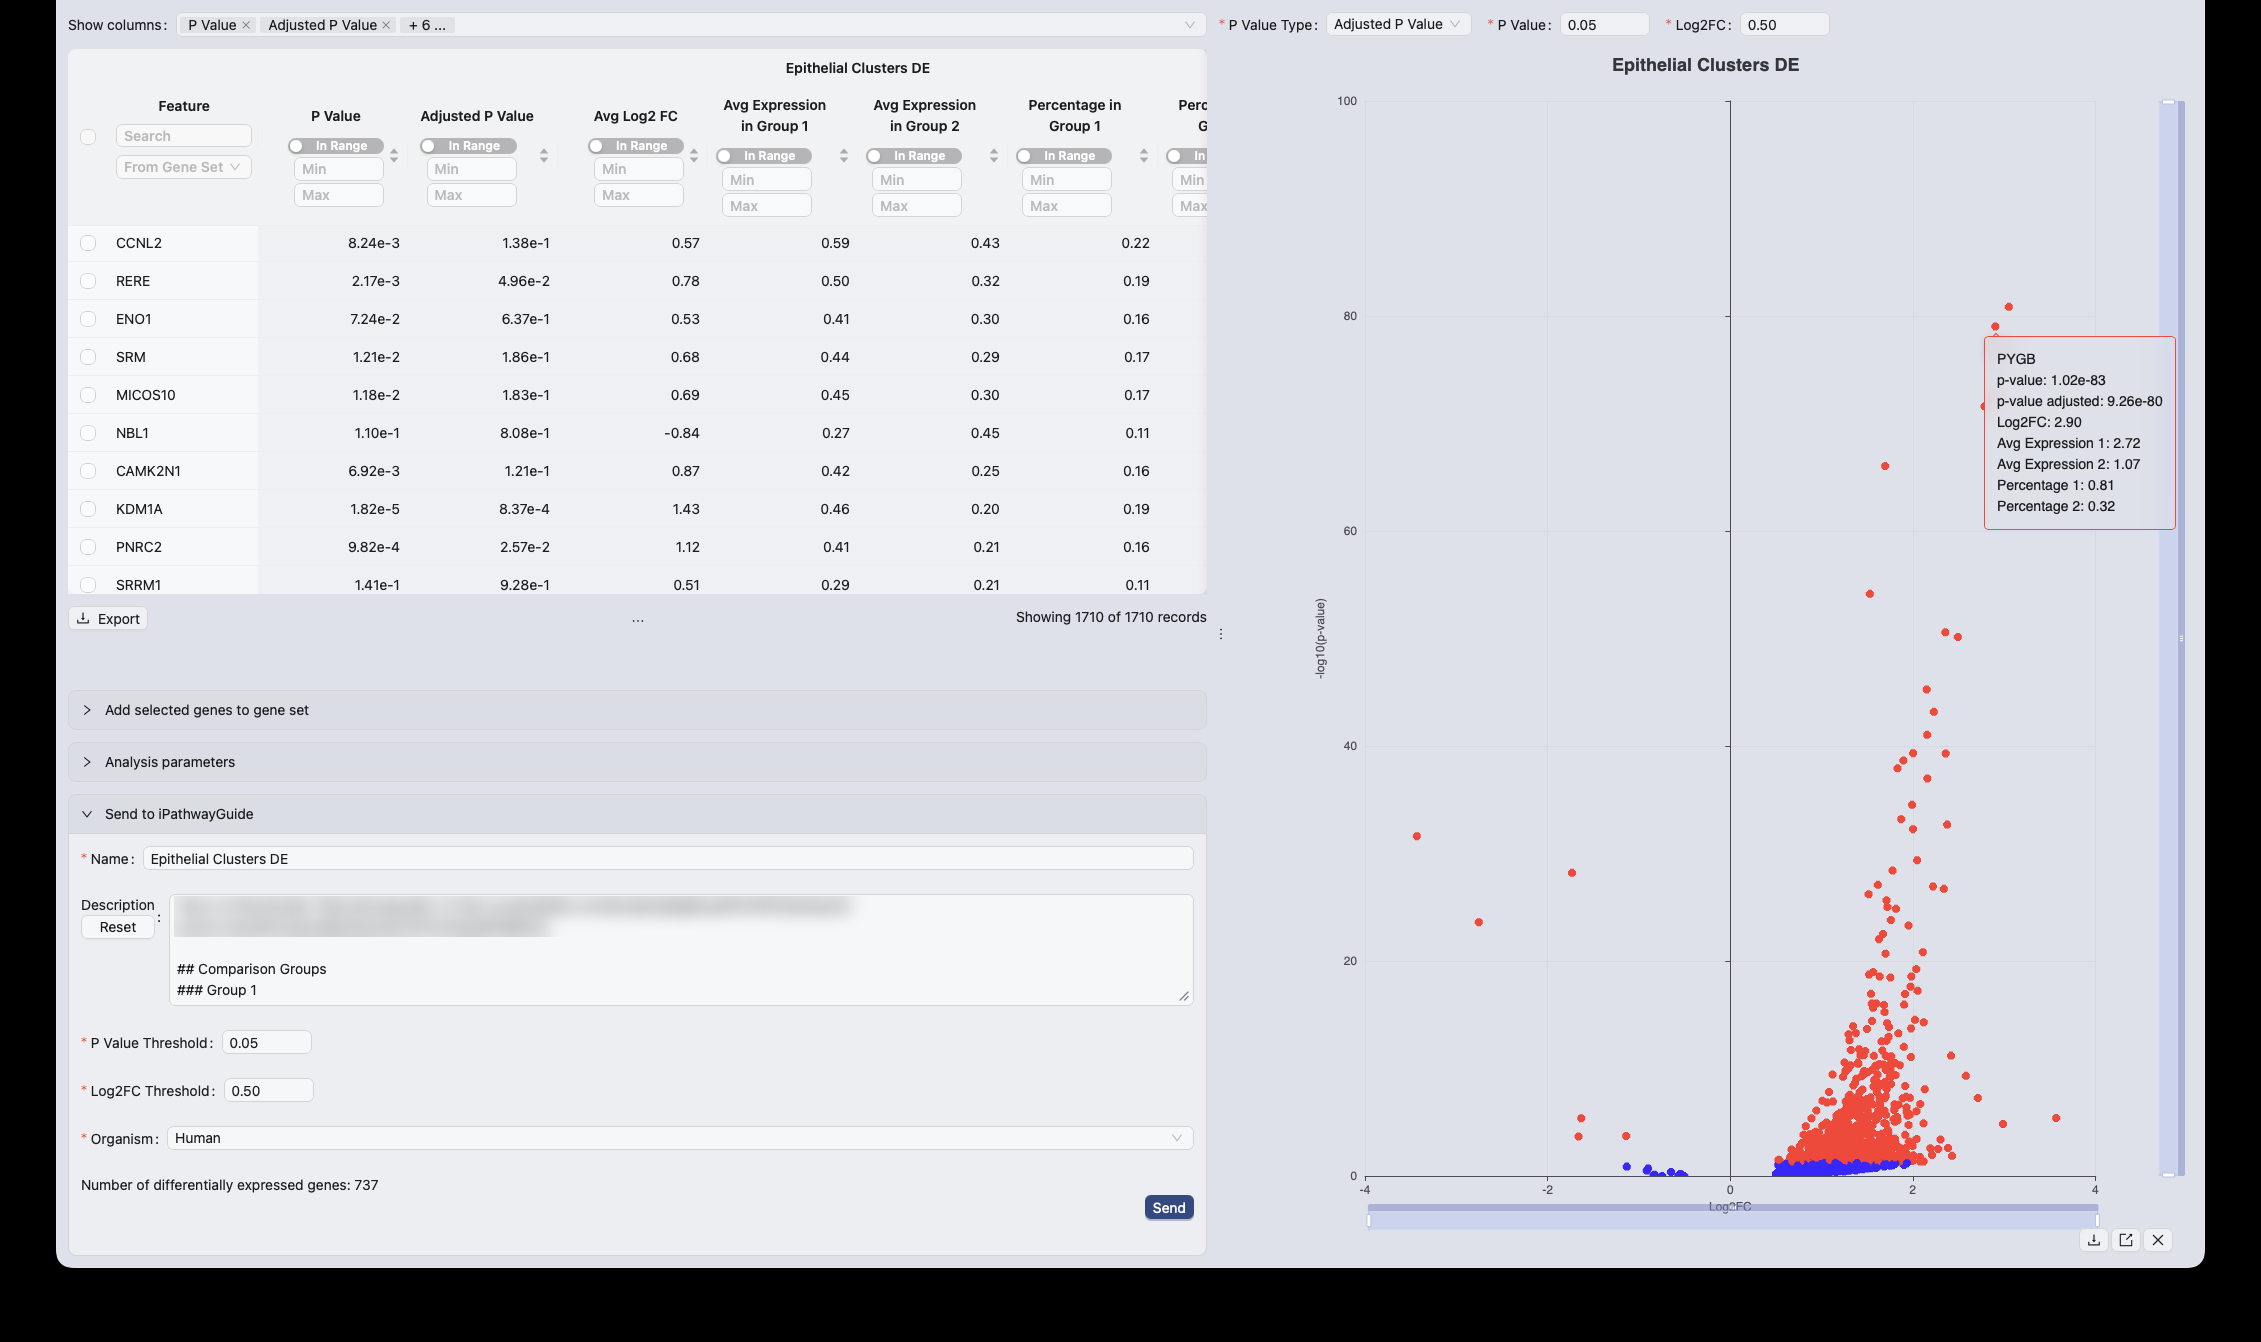
9Read the volcano plot
The volcano plot puts fold change against significance. Genes furthest up and to the sides are the strongest results. Selecting in the plot filters the table alongside it.
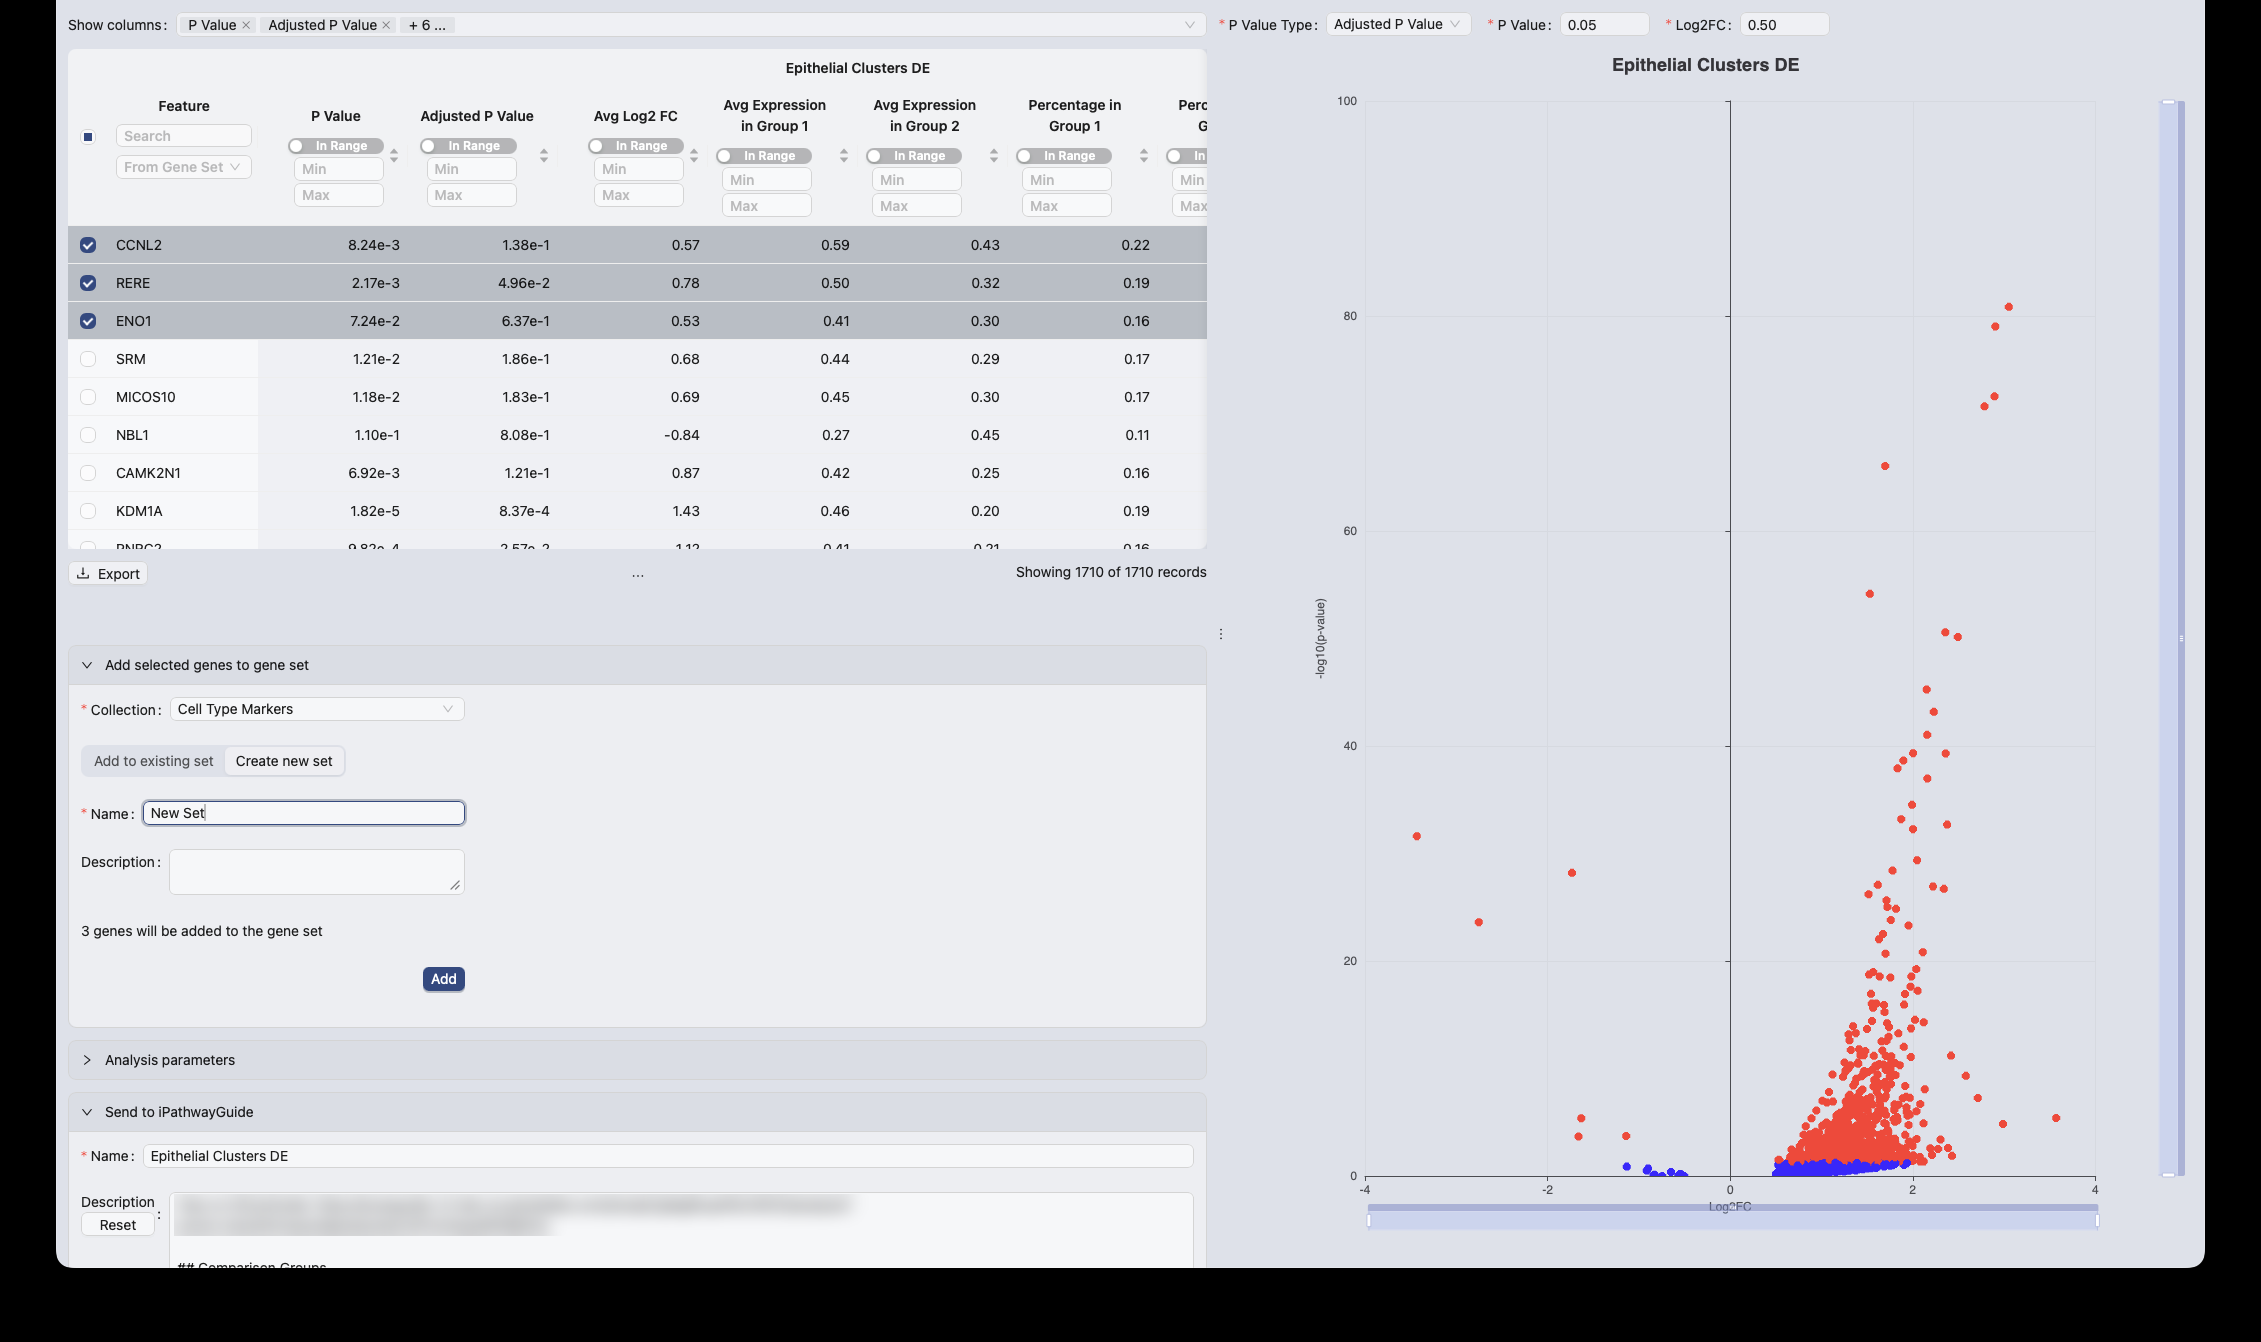
10Save genes to a gene set
Select genes in the table and save them as a gene set, either into an existing collection or a new one. Saved sets can be used for enrichment and for filtering features when building an embedding.
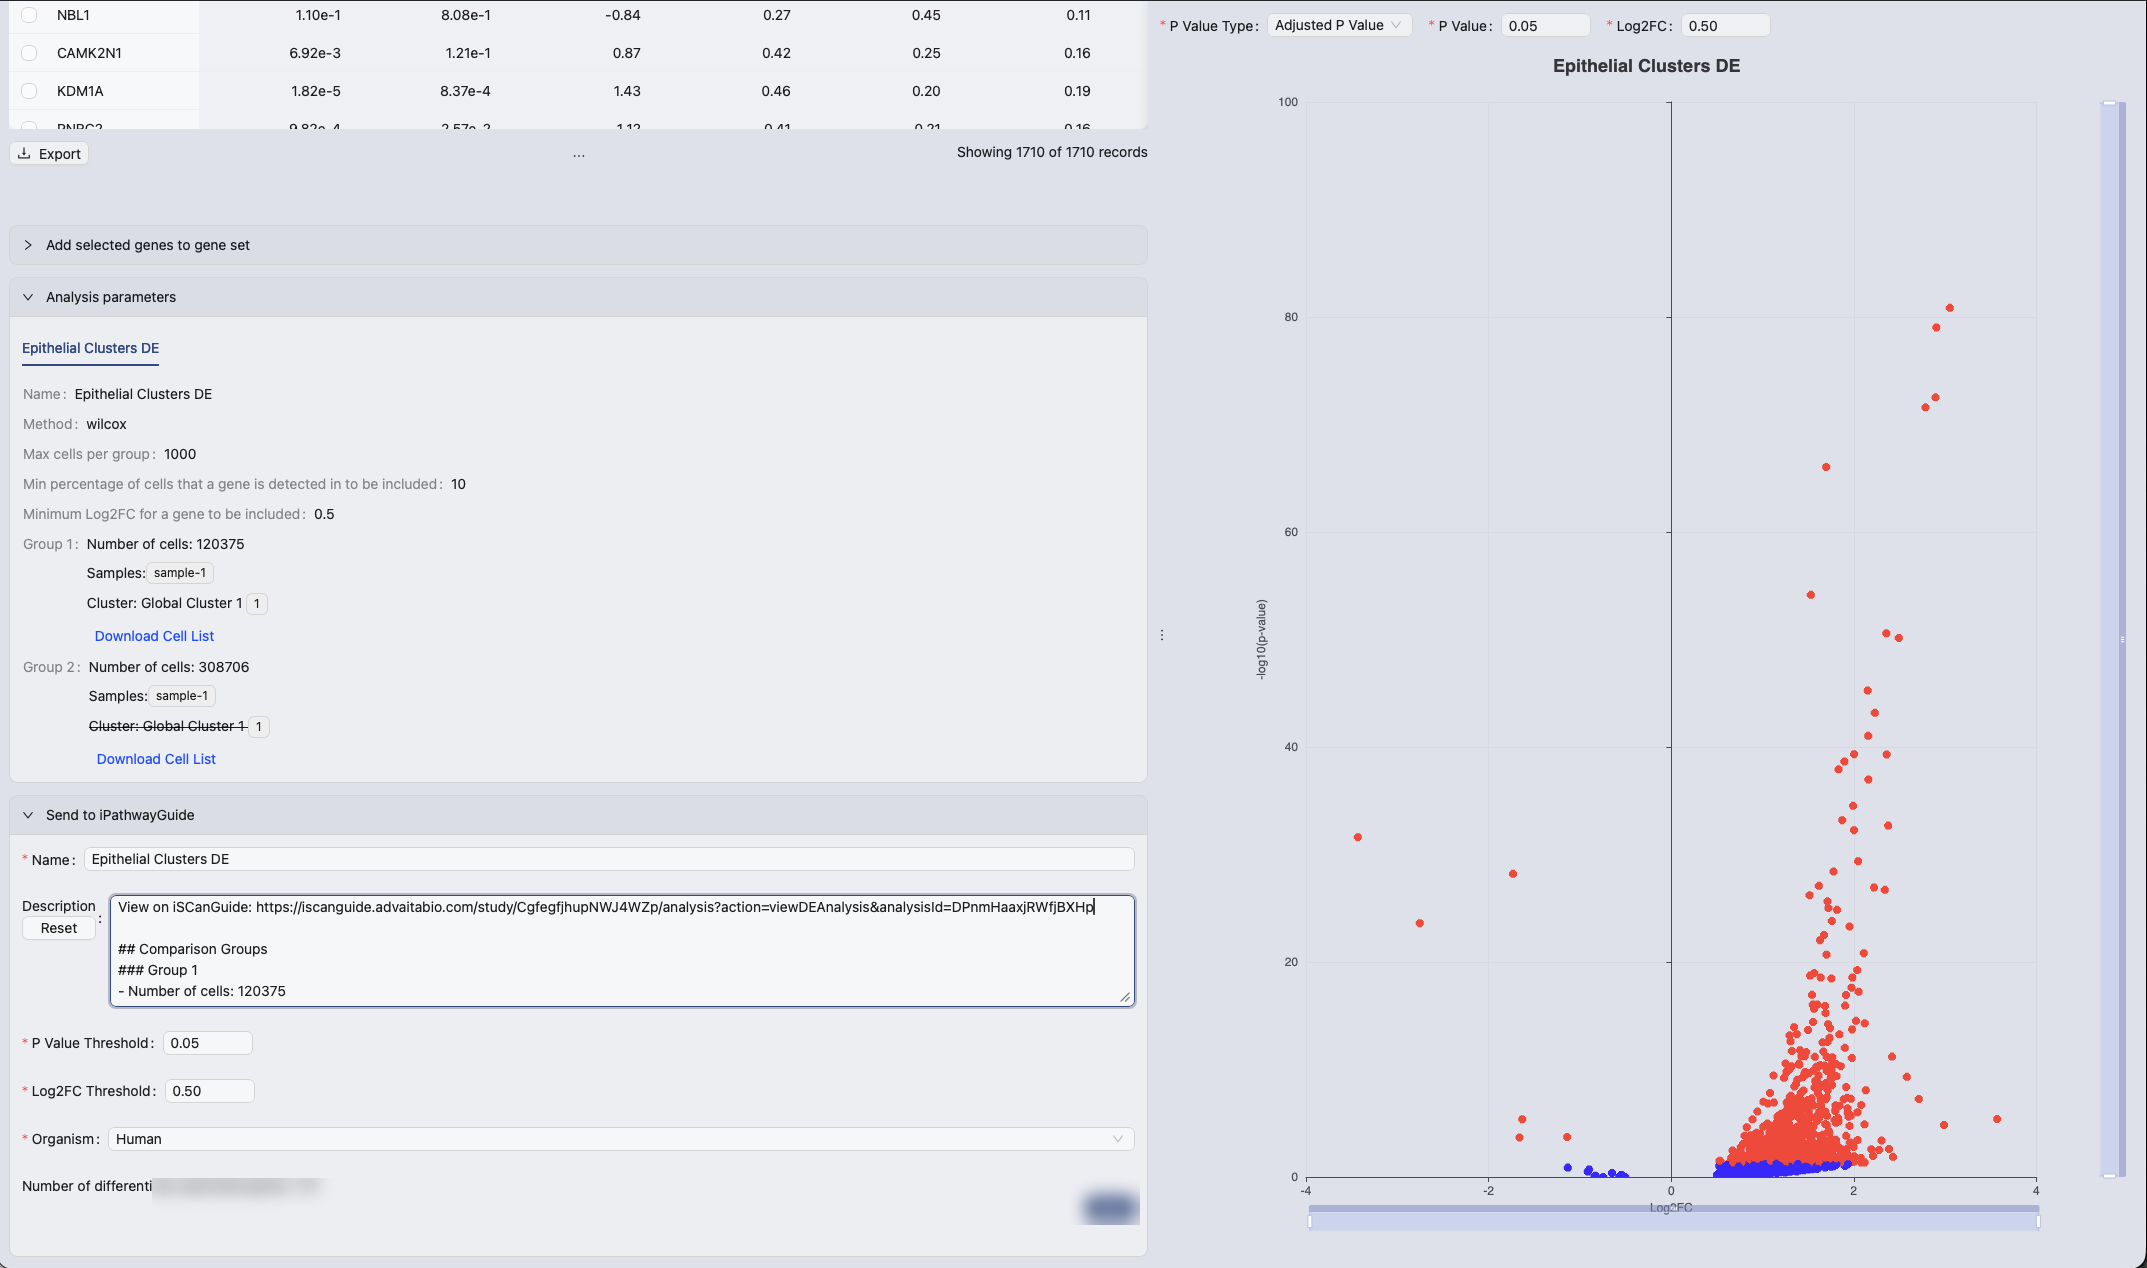
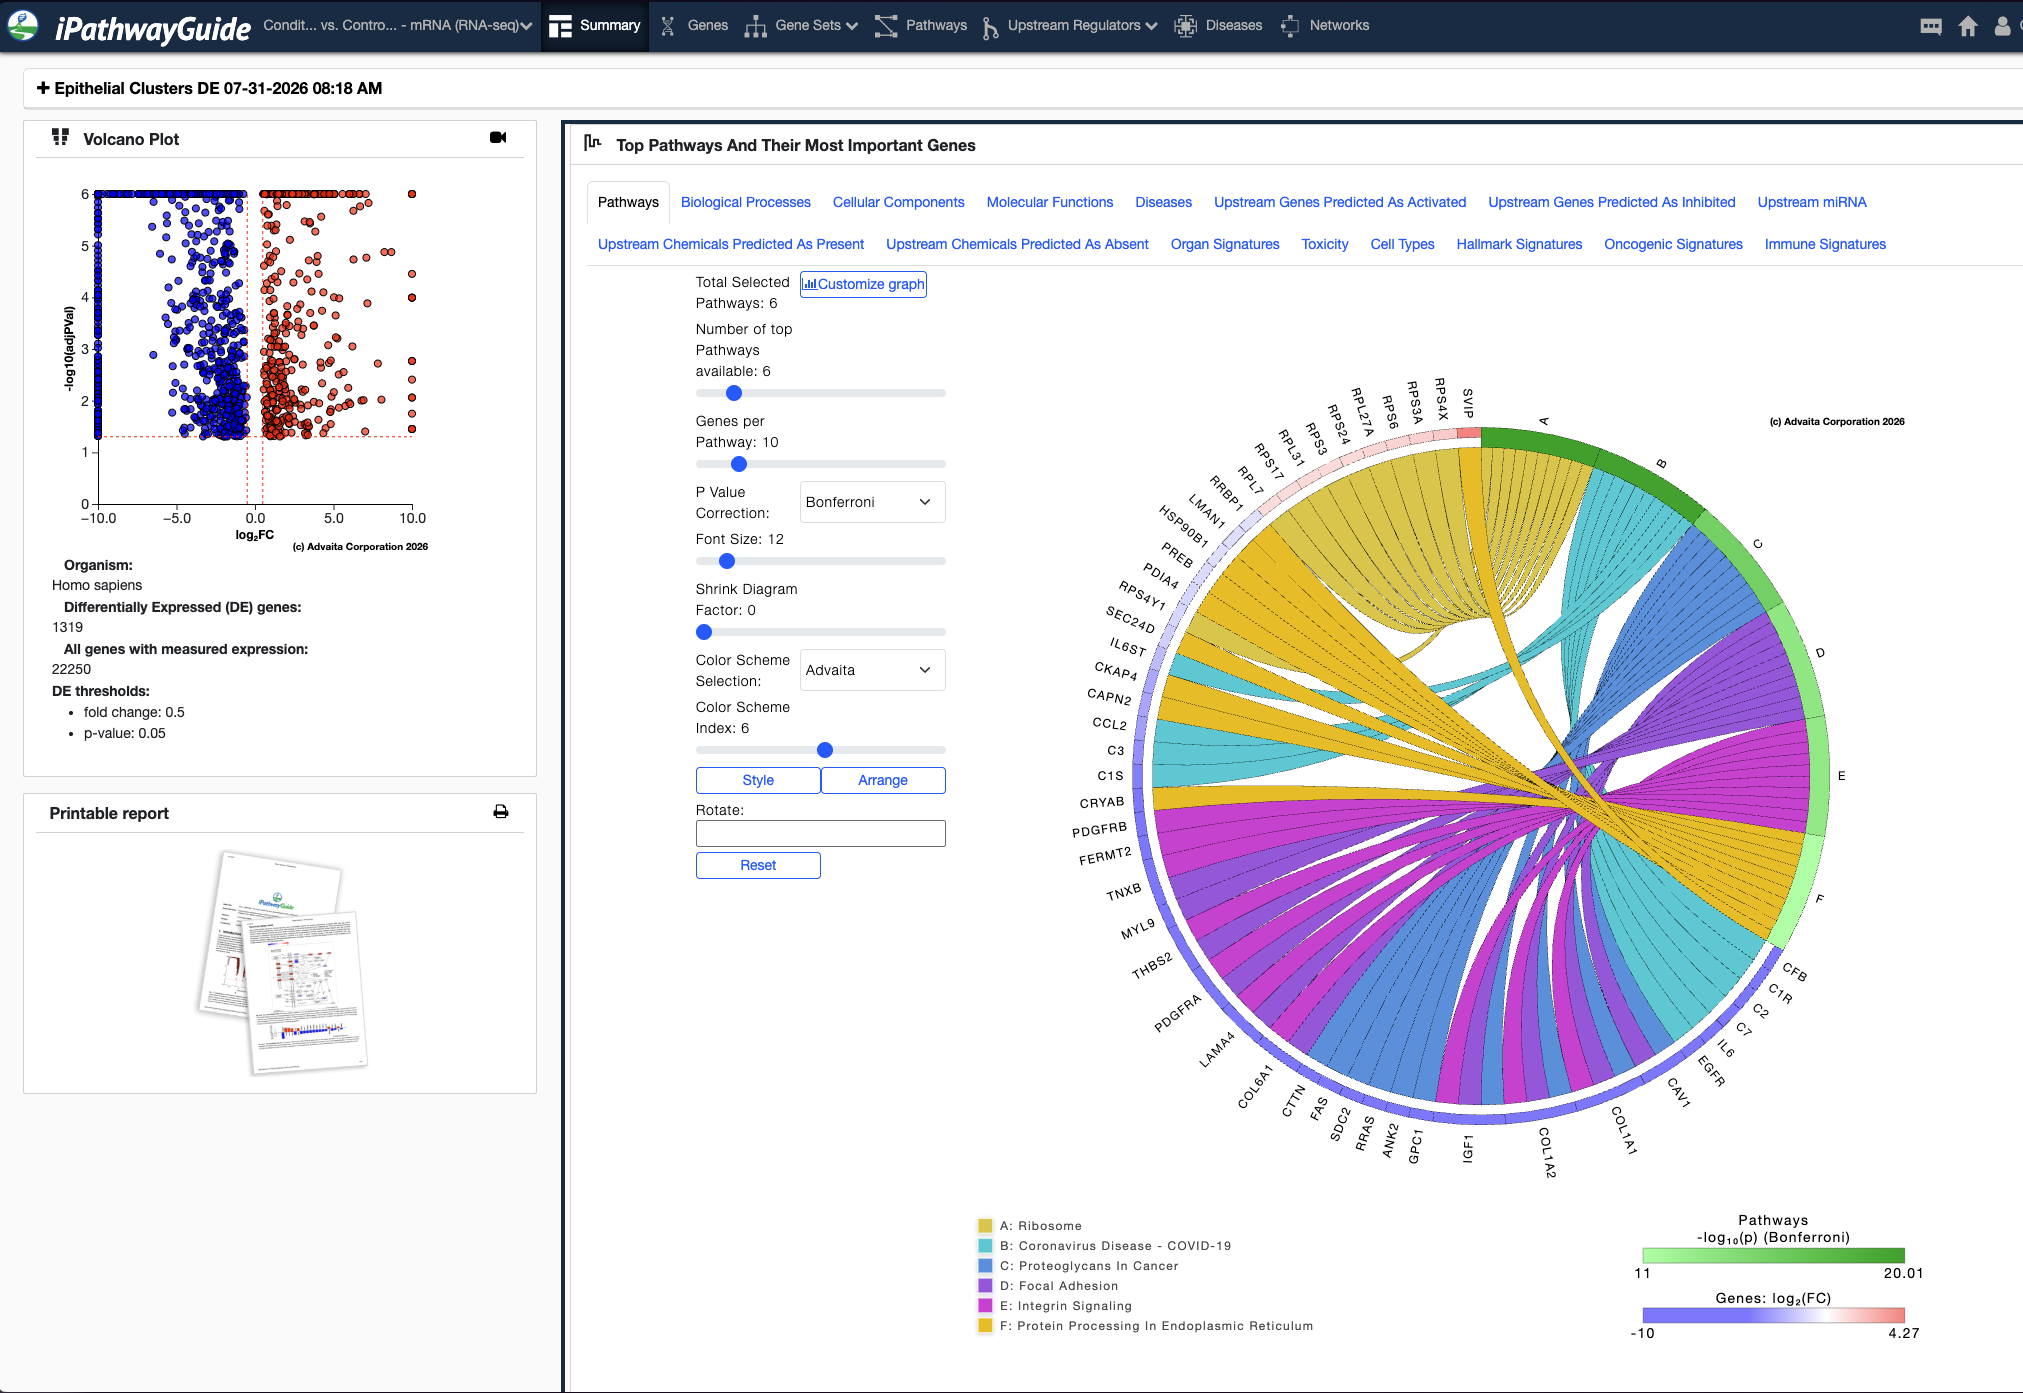
11Send to iPathwayGuide
Send your results to iPathwayGuide for pathway analysis. Expand Send to iPathwayGuide, check the Name and Description, confirm the thresholds and Organism, then click Send.
Reference
Organism offers Human, Mouse and Rat.
The thresholds start from the ones set on the volcano plot, so changing them here changes which genes are sent. Reset beside Description restores the generated description.
Note: Send is unavailable above 5,000 genes. Tighten your thresholds to bring the list under the limit.
Note: the panel appears when a single differential expression result is open.
12Track your iPathwayGuide report
Everything you have sent from this result is listed beneath the form, with its status. When a report finishes, its name becomes a link that opens it in iPathwayGuide.
Reference
The table records each report's Name, Description, Status, Organism, the thresholds it was sent with, when it was created, and when its status was last checked. Statuses refresh while the table is open.
13Export and revisit
Click Submit to run the analysis. Export the results as CSV. Every saved analysis keeps its parameters, so you can see exactly how a result was produced when you come back to it.